
Why it remains a stock picker's market
A picture speaks a thousand words they say, and this one speaks volumes.
I highlighted Erie Indemnity in an article I wrote in early June, at the time the stock was trading at $227.22. A month later, the insurance company and former sector laggard is up by almost +$30.00 or +13.0% higher.
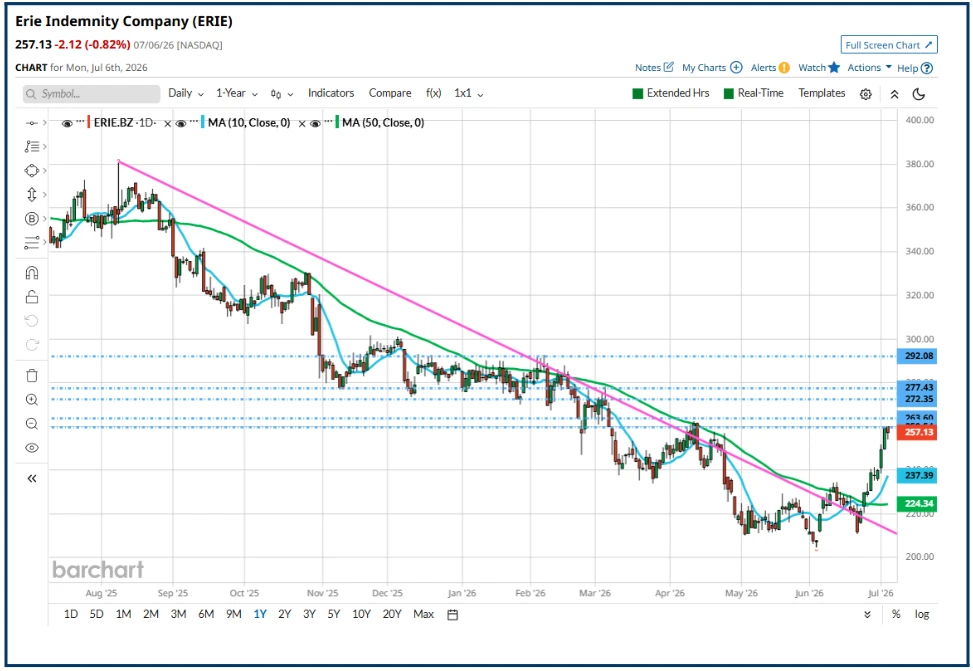
Source: Barchart.com
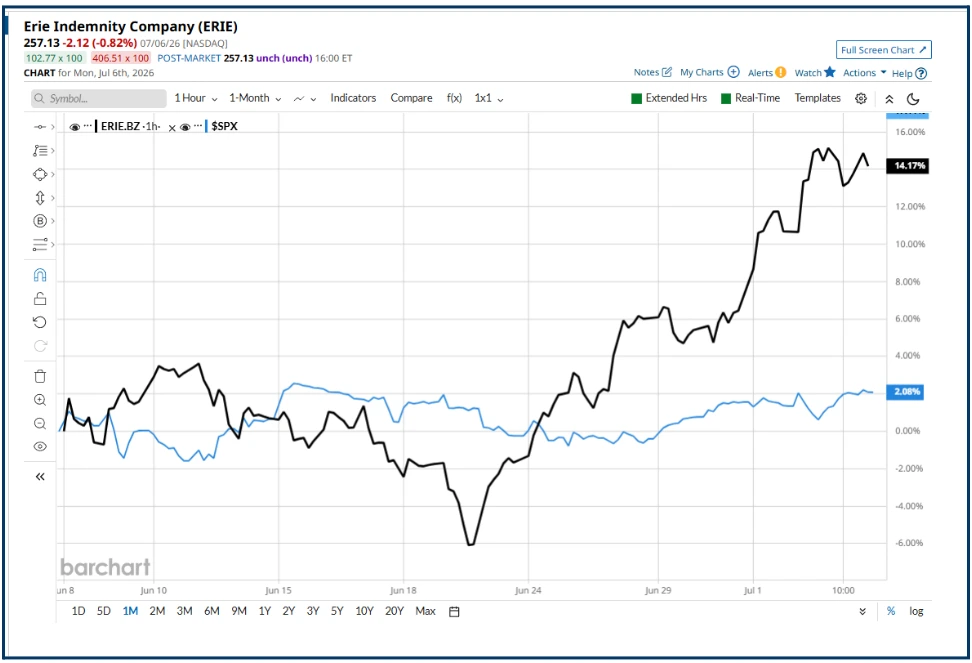
Here is ERIE US compared to the S&P 500 over that month, and as you can see, the stock massively outperformed the broader market, which, of course, is exactly what you want from a stock pick.
Because when you trade a single equity, you are taking on more risk compared to trading in a diversified index of stocks. And to justify that additional risk, you need to be compensated in terms of your reward.
In other words, buying a stock that just matches the index return is “selling yourself short”, from a risk-reward POV.
High probability, high-reward trades are what we are after.
Source: Barchart.com
Plenty to choose from
Goldman Sachs recently pointed out that the rolling 1-year correlation between the Market Cap-weighted and Equal-weighted versions of the S&P 500 had fallen to as low as 79.0%.
This may not sound significant until you consider that the two versions of the index contain the same stocks, which, in theory, means they should be very closely and positively correlated indeed.
The fact that the degree of correlation is drifting lower tells us that individual stocks are doing their own thing, rather than just reacting to what happens to the megacap stocks at the top of the tree.
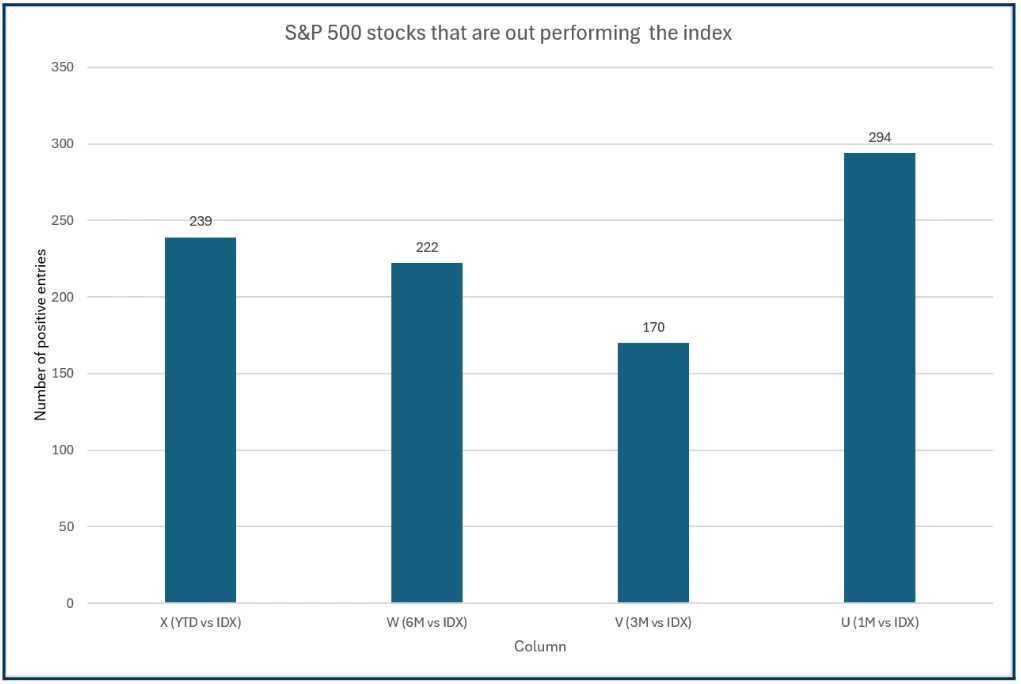
Another way of looking at this is to count the number of constituent stocks that are outperforming the index that they are part of
The chart below captures this data for the S&P 500 stocks over 4 time frames: YTD, 6 months, 3 months and 1month periods.
Source: Barchart.com/Darren Sinden
To my mind, it's very telling that the number of stocks outperforming the index has increased sharply over the last month, to stand at 294, meaning that well over half of the index constituents are outperforming the benchmark.
And don't think that higher beta stocks are necessarily the ones that are outperforming. In fact, if we analyse the correlation between stock beta and one-month percentage price change, among the S&P 500 stocks, we find it's very weak and barely positive.
Sector selector
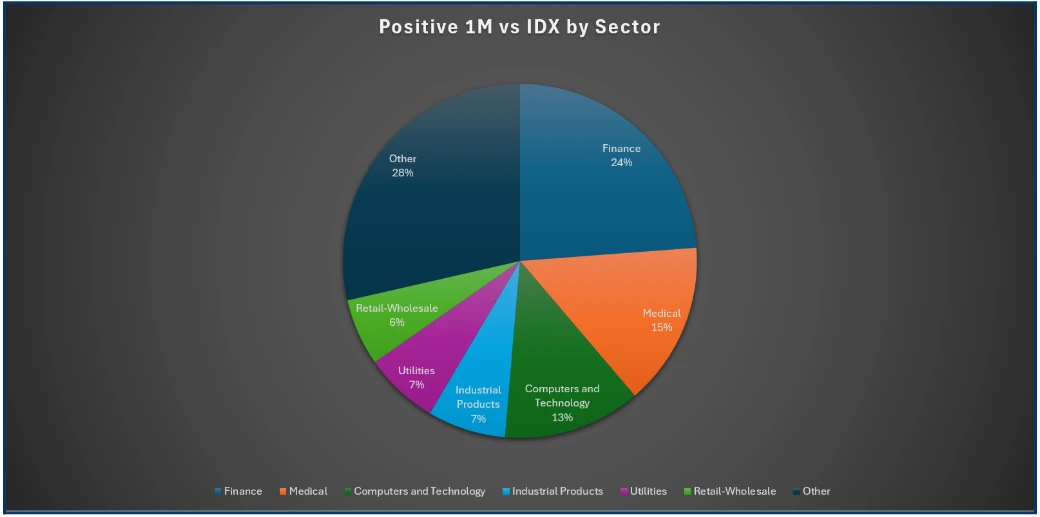
In terms of which sectors contain the most stocks that are outperforming the S&P 500 over the last month, we can break it down as follows.
Financials have the highest number of outperformers with 24.0% of the 294 names residing here.
Medical/Healthcare accounts for another 15.0%, and Information Technology (Computers) makes up a further 13.0%.
Source: Barchart.com/Darren Sinden
The very fact that other sectors (an amalgamation of lower scorers) account for 28.0%, the biggest piece of the pie chart, shows just how diversified the outperformance is.
Of course, earnings season kicks off in the US next week, and the introduction of all that new information, in combination with the high levels of dispersion in individual stock performance, is an exciting prospect for traders.
The information provided does not constitute investment research. The material has not been prepared in accordance with the legal requirements designed to promote the independence of investment research and as such is to be considered to be a marketing communication.
All information has been prepared by ActivTrades (“AT”). The information does not contain a record of AT’s prices, or an offer of or solicitation for a transaction in any financial instrument. No representation or warranty is given as to the accuracy or completeness of this information.
Any material provided does not have regard to the specific investment objective and financial situation of any person who may receive it. Past performance is not a reliable indicator of future performance. AT provides an execution-only service. Consequently, any person acting on the information provided does so at their own risk.