
If you spend time chatting to traders, you will hear and read your fair share of peculiar phrases and sayings; it's just that kind of business.
One of the oddest phrases traders use is “10-bagger”.
A 10-bagger is a stock or other investment whose price rises 10- fold.
So, for example, a stock whose price rallies from $1.00 to $10.00.
Traders talk about 10-baggers when they are describing stocks they own or have owned, because they are proud of their achievements and the return they generated.
And why wouldn't they be, because if you put 10.0% of your portfolio into a stock that rallied 10-fold, you would, in theory, have doubled your portfolio size, all else being equal.
It's math like that, really shows how compounding growth works over time.
How common are 10- baggers?
Not that common is the answer, for example, if we look at the current constituents of the S&P 500 index and examine their performance over the last 5-years, we find that there are just 4 stocks which have posted gains of +1000.0% or more in that period.
They are Nvidia NVDA, Comfort Systems FIX, Lummentum LITE, and Vertiv Holdings VRTV.
The chart below plots the 5-year percentage change in all 4 stocks on the same chart.
What immediately struck me was that Nvidia was not the best performer in this timeframe.
Not only that, it was outperformed by a company that you have probably haven’t heard of.
Comfort Systems FIX US, which provides and maintains heating and ventilation systems to commercial properties and industrial premises.
S&P 500 Stocks that are up +1000.0% or more over 5-years.
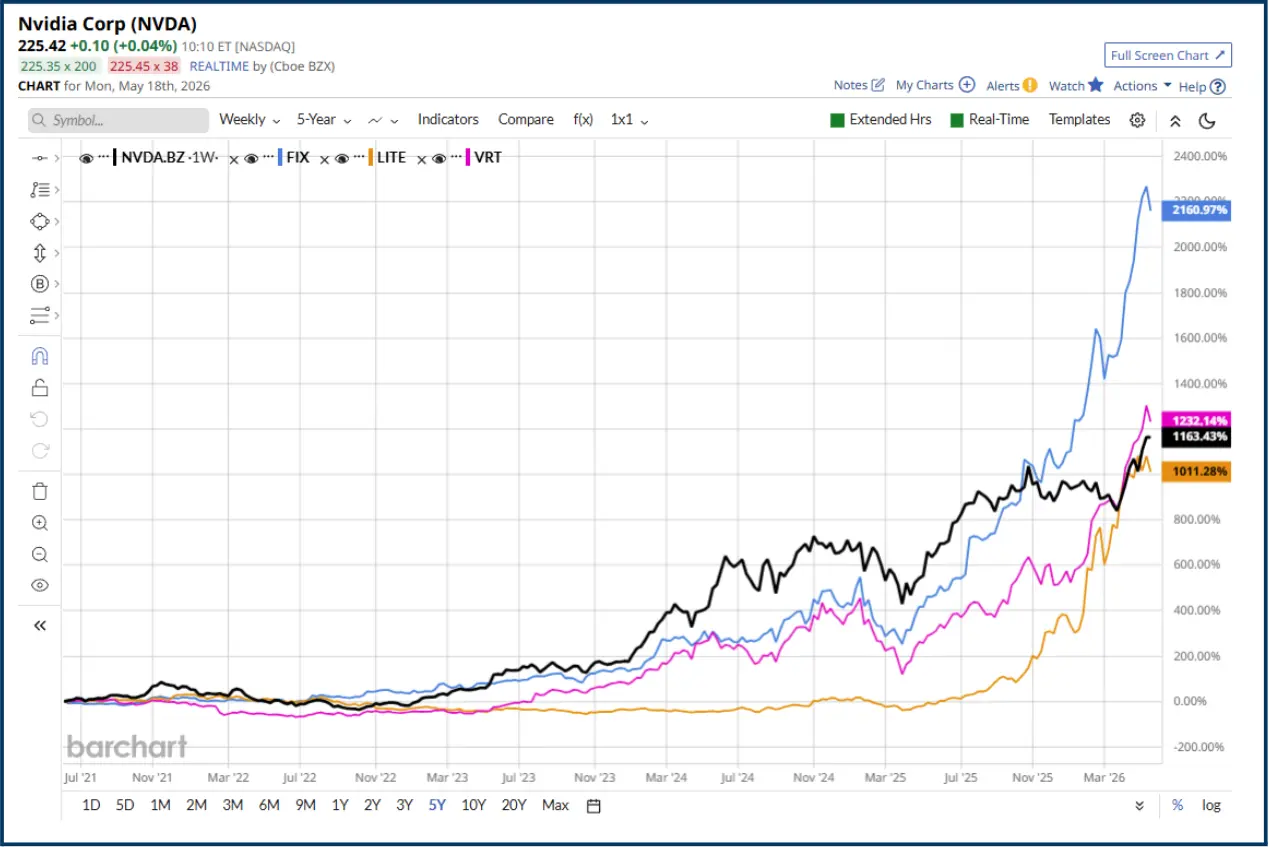
Source: Barchart.com
Note that if we had chosen a different time frame, we would have ended up with a different list.
Are there more 10- baggers in other indices?
You might think there would be a higher frequency of 10-bagers among small (faster-growing?) companies.
However, if we take the S&P 600 Small Cap constituents and look back over their 5 year performance, we find that there are only 3 stocks that have enjoyed a 10-fold or greater price increase.
If we expand the list to the Russell 3000 index, which captures the vast majority of US-listed market-cap stocks, we find that 20 stocks fit the criteria.
Information technology is well represented in this list ( see below), but there are also names from Industrials, construction and basic materials as well. What we might think of as old economy industries and areas.
We can also see that the price gains these stocks have enjoyed are not just historic, with half of the list posting year to date rallies of +100.0% or more.
Russell 3000 stocks with a 5-year gain of 1000.0% or more
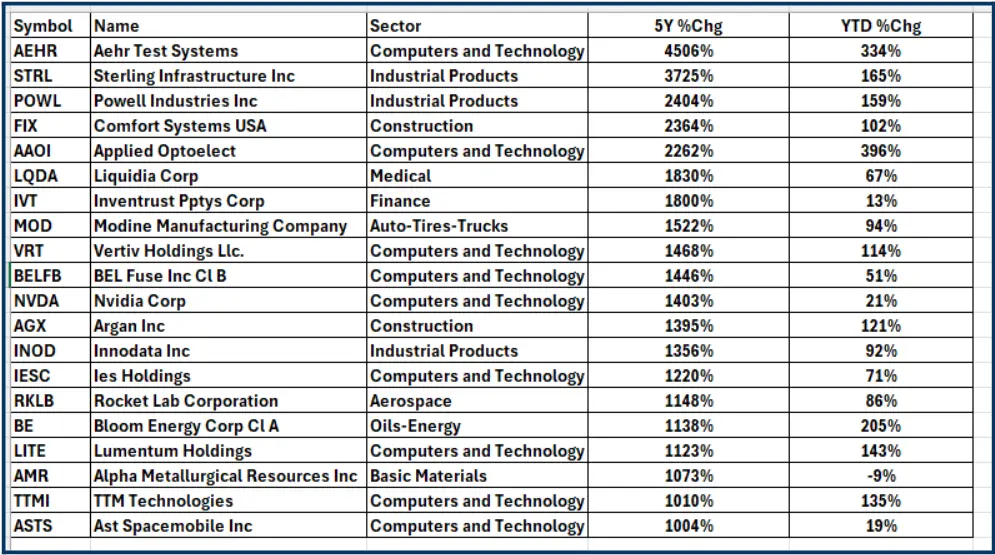
Source: Barchart.com/Darren Sinden
Sometimes it happens quickly.
Of course, not every stock takes 5-years to become a 10- bagger some get there much quicker. The most obvious example of recent times is dynamic memory manufacturer Sandisk SNDK, which achieved the feat in approximately 8-months. See below.
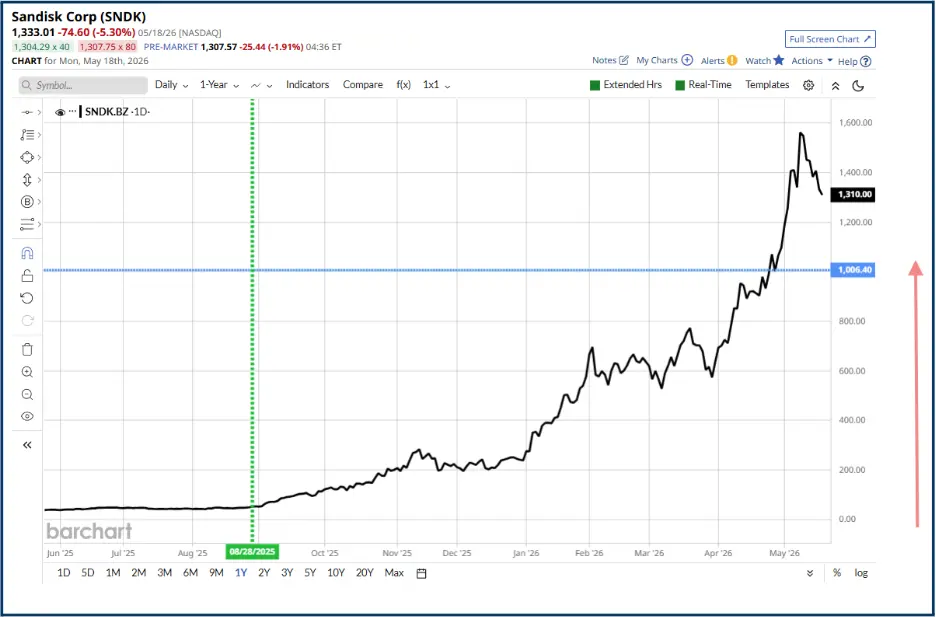
Source: Barchart.com
Sandisk is very much a special situation: the right stock with the right products at the right time.
How can we try to identify potential 10-bagger stocks?
There are a couple of ways, if you have access to fundamental data, you can look for stocks which are growing faster than their peers. Stocks whose sales/ revenues are expanding rapidly. And who are generating and retaining plenty of cash flow.
Ideally, you would want to see costs being kept under control and increased turnover being reflected in the bottom line as well, that is, EPS, or earnings per share, growth in line, or even ahead of the rate of revenue growth.
Alternatively, we could use a statistical approach and look for stocks that are posting new price highs.
In the chart below, I have filtered the Russell 1000 index for the 20 stocks with the highest number of 5-year price highs. And I have added the number of 52-week and 3-month highs as well, and displayed the data in a stacked column chart.
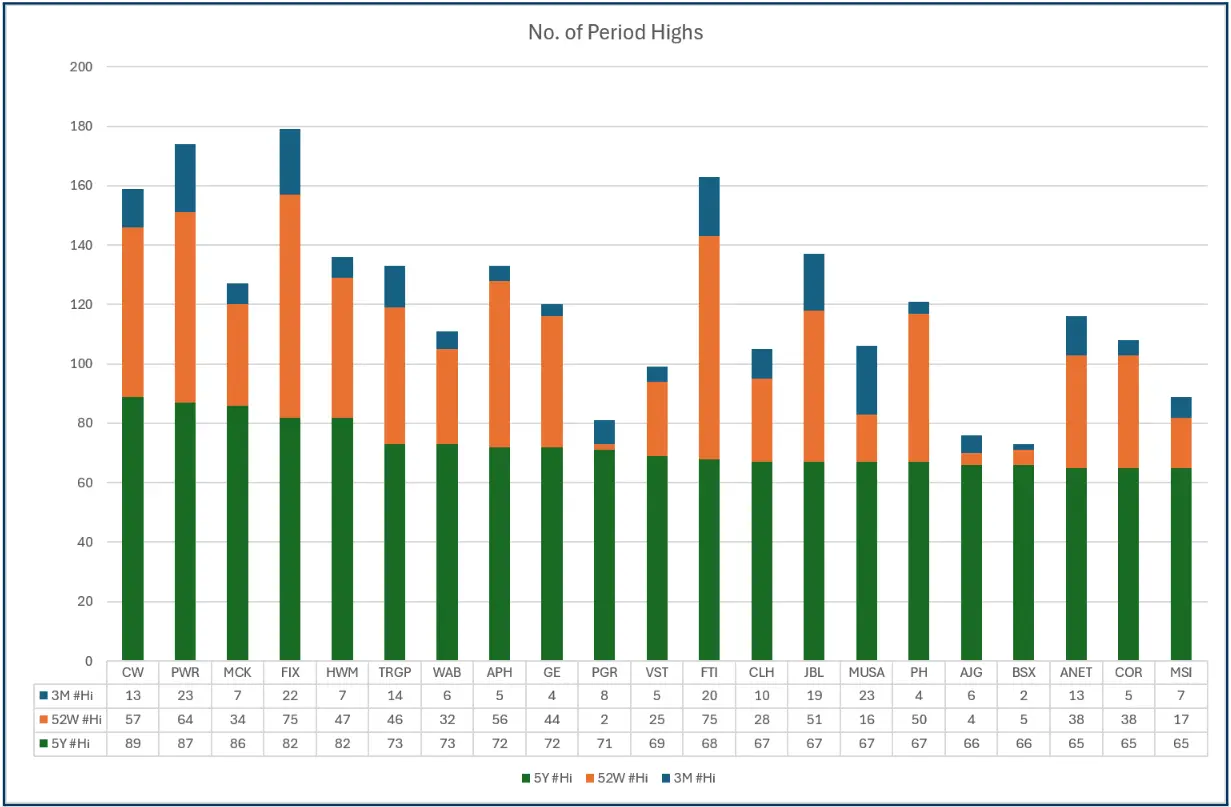
Source: Barchart.com/DarrenSinden
Look at the ticker FTI (oil services firm Technip) in the middle of the chart above.
Notice that Technip has an extended central section (52-week highs) and a growing upper section.
(3-month highs) which suggests sustained upside price momentum (a fancy way of saying it keeps going up).
Now let's examine what that looks like on a price chart, in this case, a 2-year percentage change line chart. (see below. Technip stock is up by more than +184.0% over this time frame, and it has been higher.
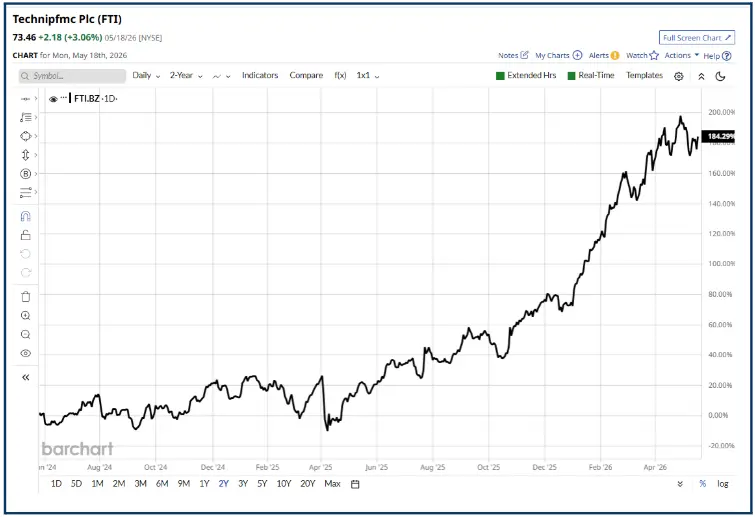
Source: Barchart.com
$77.78 is the 20 year high in Technip, and that's an area to set a price alert in. Because if it's going to continue to move higher/maintain its long-term momentum, then it will need to take that level out and move above it. And that's exactly the sort of thing we want to be aware of as traders, when it happens.
The information provided does not constitute investment research. The material has not been prepared in accordance with the legal requirements designed to promote the independence of investment research and as such is to be considered to be a marketing communication.
All information has been prepared by ActivTrades (“AT”). The information does not contain a record of AT’s prices, or an offer of or solicitation for a transaction in any financial instrument. No representation or warranty is given as to the accuracy or completeness of this information.
Any material provided does not have regard to the specific investment objective and financial situation of any person who may receive it. Past performance is not a reliable indicator of future performance. AT provides an execution-only service. Consequently, any person acting on the information provided does so at their own risk. Forecasts are not guarantees. Rates may change. Political risk is unpredictable. Central bank actions may vary. Platforms’ tools do not guarantee success.