
Wendy’s WEN US, which by some measures is the third-largest quick-service restaurant chain in the world, is an also ran when it comes to stock market performance.
Down by more than -66.0% over 5-years, and as we can see in this chart its massively underperformed rival burger chain McDonald's MCD US (shown in pink) over this time frame.
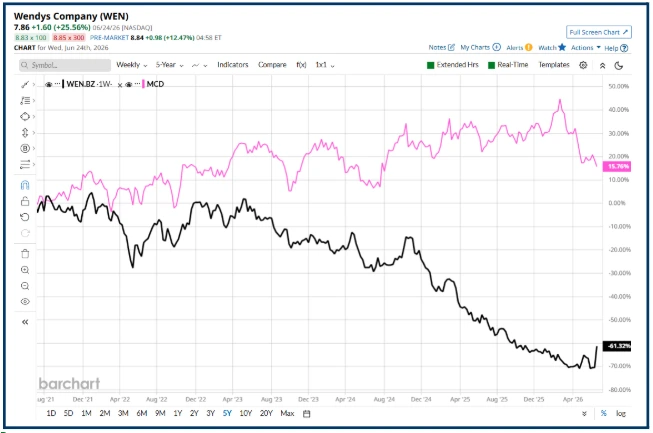
However, that might be changing because Wendy's rallied by +25.56% in Wednesday’s (24/6/26) trade, closing at $7.56, but it had printed at $8.89 intraday.
The stock price move is notable, but what I find intriguing is why it happened on Wednesday.
I say that because I shared a story on Wendy's recently with members of my Idea Factory chat, highlighting that feared corporate raider Nelson Pelz and his Trian Fund were interested in bidding for the businesses.
I did some more digging yesterday, only to find that Pelz's story had been around since February, at least. As you can see in the screenshot of headlines below.
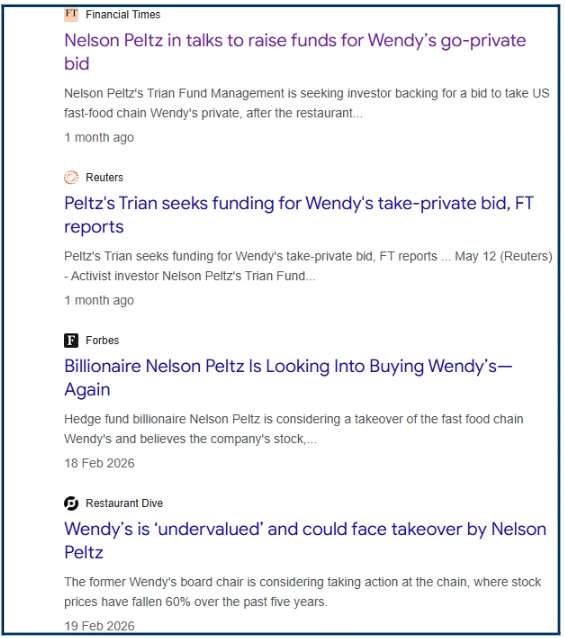
Source: Google
If we take a look at how Wendy's traded on the 24th June, we see that the price went parabolic or up in a straight line, if you prefer. For context, the stock traded at $24.20 back in 2021.
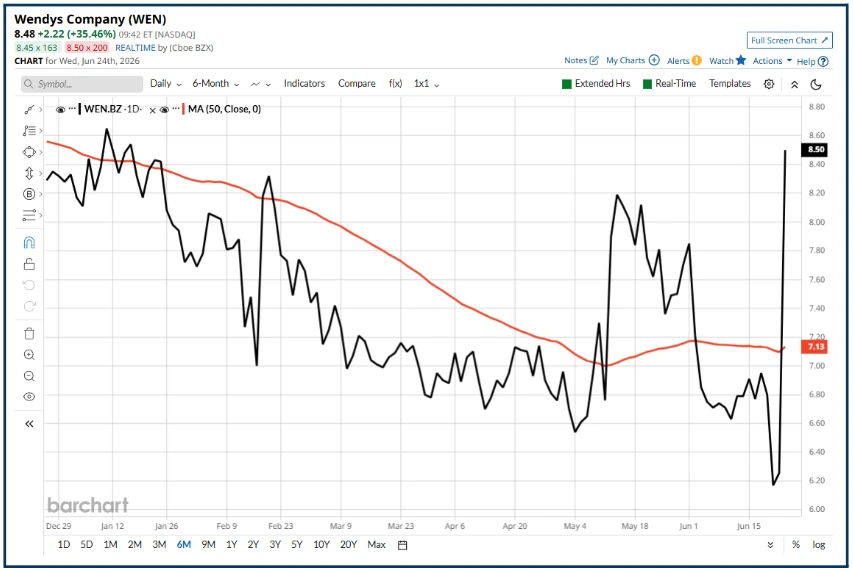
Source: Barchart.com
The price move and the volume of shares traded on Wednesday are completely distinct from anything else seen in June.
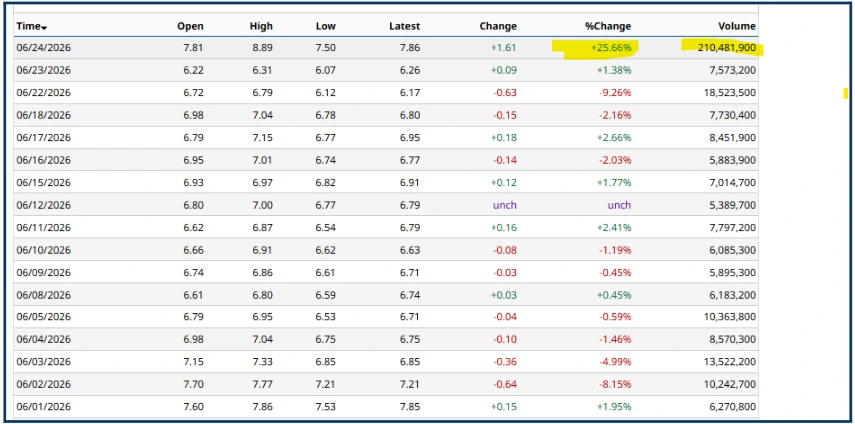
Source: Barchart.com
That change was the biggest daily price move for 2-years though there were sharp spikes in February and May this year. Oddly, they were both gains of +16.86%.
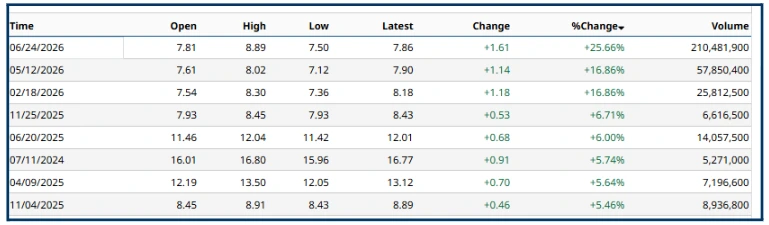
Source: Barchart.com
It seems that there was also chatter about the stock on Wednesday in the StockTwits app.
A social media platform that’s popular among retail traders. The chat appears to have been focused on the idea that Wendy's could become a short squeeze candidate in the event of a formal approach from the Trian Fund.
I am not convinced that this idea holds water, however.
Here’s why
The table below shows the short interest in Wendy’s stock up until the end of May. Short interest has been rising, almost doubling since the end of December 2025.
However, at the same time, the days to cover figure has been falling - Days to cover is simply the number of trading days required to cover the short positions in a stock based on its average daily volume.
The data for WEN US is displayed below in the right-hand column of the table.
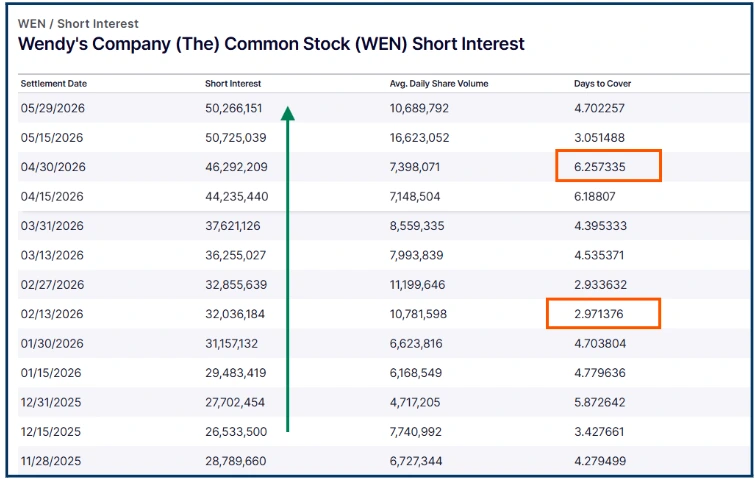
Source: Nasdaq.com
The days to cover figure had rallied between February and the end of April, moving from 2.90 to 6.25 days, but since then, it has been declining, falling to just over 3.0 days in mid-May and then 4.70 days by the month's end.
We also need to consider the jump in volume traded in Wendy’s stock, which touched 210.0 million shares on the 24th and 103.0 million on the 25th (see below).
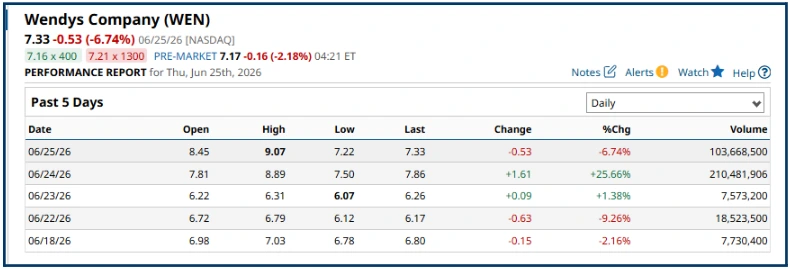
Source: Barchart.com
If the volume traded in a stock can leap 10 or 15-fold in a single day, it’s hard to argue that liquidity could be constrained.
Looking at the candle chart for Wendy's, the market wasn't convinced either.
Wednesday's candle has the look of a spinning top, a pattern associated with indecision, whilst Thursday’s candle bearishly engulfed the prior day's move, potentially negating it completely, if the stock opened lower in the regular session on Friday.
As I write, the stock is down -1.36% in the pre-market and has been lower, so the omens aren’t good.
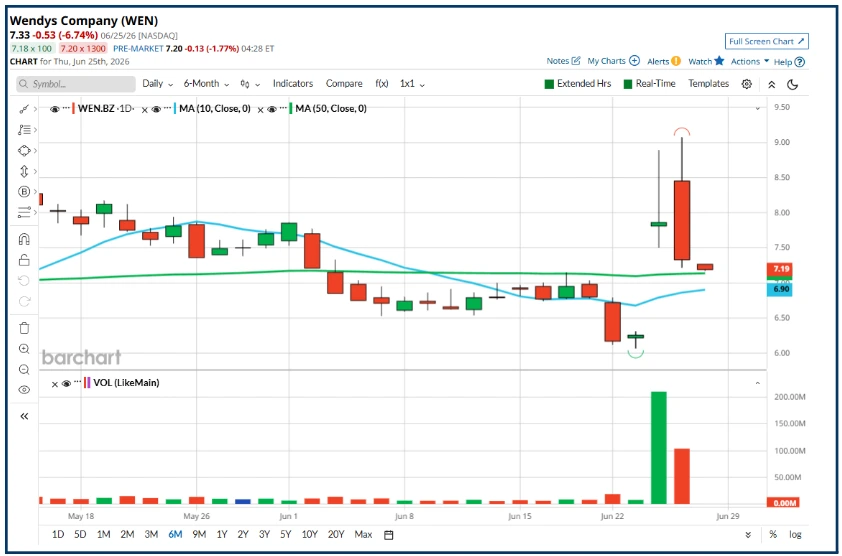
Source: Barchart.com
Wendy's could yet become a genuine takeover target and meme stock, if that’s not a contradiction in terms.
However, the more I look at the data and the price action, the more I am reminded of a book that was written 180 years ago, namely :
“Extraordinary Popular Delusions and the Madness of Crowds” by Charles Mackay.
Which chronicled the behaviour of crowds in the market, and in particular the behaviour in the financial bubbles of the 17th, 18th and 19th centuries, which included Tulip mania, and the South Sea bubble.
Viewed in that light, Wednesday's move in Wendy's looks very much like the collective hysteria that Mackay describes.
Time will tell us if I am right, but the very fact that we can see this kind of irrational price action is a warning that the market is becoming frothy. Froth that can often be blown away by a market correction.
The information provided does not constitute investment research. The material has not been prepared in accordance with the legal requirements designed to promote the independence of investment research and as such is to be considered to be a marketing communication.
All information has been prepared by ActivTrades (“AT”). The information does not contain a record of AT’s prices, or an offer of or solicitation for a transaction in any financial instrument. No representation or warranty is given as to the accuracy or completeness of this information.
Any material provided does not have regard to the specific investment objective and financial situation of any person who may receive it. Past performance is not a reliable indicator of future performance. AT provides an execution-only service. Consequently, any person acting on the information provided does so at their own risk. Forecasts are not guarantees. Rates may change. Political risk is unpredictable. Central bank actions may vary. Platforms’ tools do not guarantee success.