
The markets are like sports teams or universities in that the institution is “permanent”, but the cast of characters within them changes regularly.
I was reminded of that in recent days when I was asked to name the trading book, I have read that has left the biggest impression on me. I chose Reminiscences of a Stock Operator by Edwin Lefevere. It was first published more than 100 years ago in 1923.
The book chronicles the life and times of Larry Livingston, a trader who is closely based on the real-life Wall Street legend Jesse Livermore.
It's hard to imagine that a book written that long ago could have anything to teach modern traders, but I believe it does.
I have come in for some criticism online for that viewpoint, but as I said to one of the critics (who told me I was wrong), you have just proven my point, because it takes two views (a buyer and a seller) to make a market.
The world has changed immeasurably since 1923. The makeup of the stock market, the technology used to trade in it, and the products available to traders today are surely light-years away from the 1920s.
And yet the book chronicles how Larry Livingston was able to trade with leverage of up to 100:1 at the start of his career in the 1890s. What’s more, there were technology booms and busts in those days too, with the railways, the telegraph and later radio stocks all fuelling investment bubbles.
My view is that the more things change, the more they stay the same, because of one constant, and that is human emotion and psychology. Which runs through the market like the wording in a stick of rock (see below), a solid sweet popular at English seaside resorts.

Source: BBC
Charting our emotions
Candlestick stock charts are the perfect representation of those emotions because they capture and record the battle between Greed and Fear among market participants.
Support and resistance levels are the graphical representation of the interaction between buyers and sellers, and the lines are formed at the point where one group gains the upper hand.
Resistance occurs when the sellers become dominant enough to see off the buyers, and support is created when the buyers can absorb whatever the sellers throw at them.
We can see some horizontal support resistance lines in the 5-year weekly chart of the Ford Motor Company F US below.
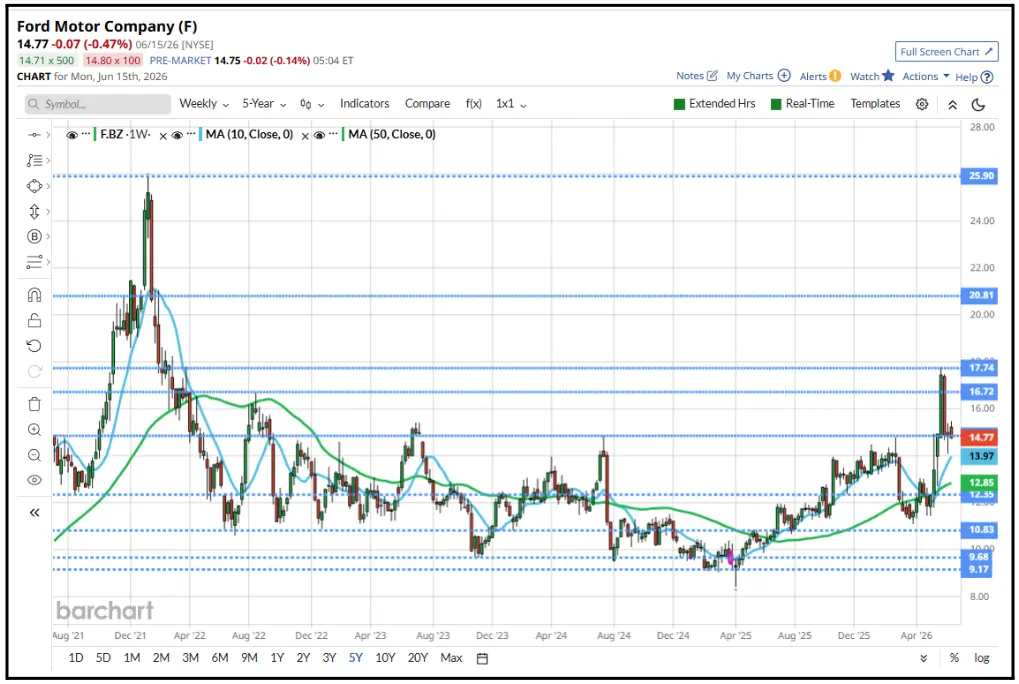
Source: Barchart.com
Those lines of support/resistance are broken when sentiment changes, that is, when greed overcomes fear, buyers overcome sellers or vice versa.
When the balance between supply and demand shifts, then so does the price of an instrument, as we can see in the 6-month daily chart of Ford below.
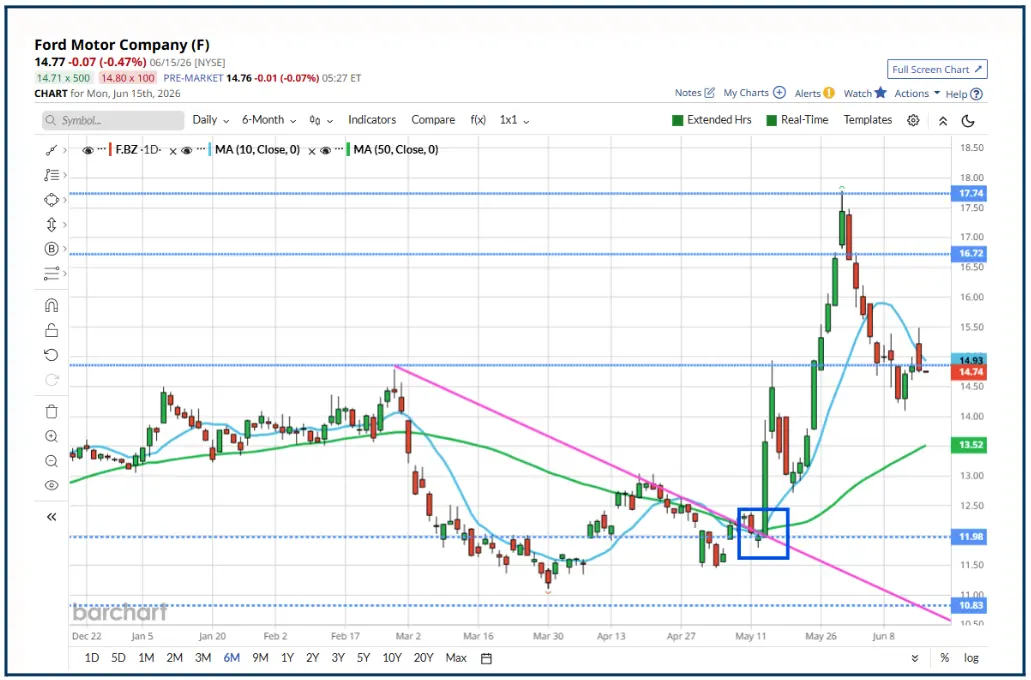
Source: Barchart.com
Before the 12/13th of May, Ford had been in a downtrend, highlighted by the diagonal magenta line.
Sentiment changed on the 13th May, however, (blue box), and buyers piled into the stock, which rallied by nearly +15.0% in one day, and by almost +44.0% by May 29th.
Though sellers were found just below $14.00 on Friday 15th, and on the following Monday, the 18th. However, once they were out of the way, the rally continued.
We could find dozens of similar examples in the charts of the S&P 500 stocks or, indeed, within any major index; the gains in Ford came about because of the introduction of new information, which tipped the balance of power in favour of greed, and away from fear.
The interplay of those two base emotions is what’s behind most price action in today's markets, just as it was back in 1923.
A bridge too far (for now)
That may be about to change, however, with the introduction of AI, because AIs shouldn't get emotional. Though some experiments suggest that they can, or at least that they can act in a way that mimics emotions and traits such as self-preservation.
Whether current AI technology is sufficiently advanced to create and manage a completely autonomous trading bot remains to be seen.
And for that bot to be emotionally neutral, it shouldn't be trained on text and data that we have created; instead, it should use machine learning to develop its own understanding of what works and what doesn't in the markets.
Other examples
If you wanted to find other examples of how our emotions manifest themselves in the markets, you only need to consider the concepts of overbought, oversold and mean reversion.
This is the tendency for stocks that have experienced an outsized price change to move back towards their average trading level over time. You can also witness this trend in valuations, within sectors and industries, where stocks often cluster around similar PE levels.
If a stock deviates from that valuation band, traders start to look at why that’s happened and whether it’s justified. If it is, the next question is whether the other stocks in the sector are now under- or over-valued?
If it's not justified, then the stock should fall back into line with its peers, but if it is justified, then we may see arerating of other stocks in the sector/industry, particularly among stocks that have similar characteristics to the stock which moved first.
The RSI 14 indicator tracks the extremes of Greed and Fear over a fixed trading period (often 14 days), with readings above 70 and below 30 indicating that a stock has become overbought or oversold, relative to its trading pattern, during the previous 14 days, or other period under observation.
Divergences between the direction of price and RSI indicators are often a signal that sentiment could be about to change in that stock.
For now, at least, Human Greed and Fear/Supply and Demand, and the balance between them, are the most important factors in the market, and while we Humans make up the majority of market participants, that’s likely to remain the case.
The information provided does not constitute investment research. The material has not been prepared in accordance with the legal requirements designed to promote the independence of investment research and as such is to be considered to be a marketing communication.
All information has been prepared by ActivTrades (“AT”). The information does not contain a record of AT’s prices, or an offer of or solicitation for a transaction in any financial instrument. No representation or warranty is given as to the accuracy or completeness of this information.
Any material provided does not have regard to the specific investment objective and financial situation of any person who may receive it. Past performance is not a reliable indicator of future performance. AT provides an execution-only service. Consequently, any person acting on the information provided does so at their own risk. Forecasts are not guarantees. Rates may change. Political risk is unpredictable. Central bank actions may vary. Platforms’ tools do not guarantee success.