
In a previous article, we provided a detailed explanation of what moving average were and why they were relevant for traders. Let’s now have a look at the best ways you can use them in your trading strategy.
How to use moving averages in trading: Popular moving averages strategies
Using moving averages for spotting trends
Moving averages are widely used by traders to identify trends. Their effectiveness lies not just in their ability to smooth out price data, but also in the valuable insights gleaned from the relationship between the moving average's slope and the current price.
In this section, we’ll delve deeper into how the moving average's slope, combined with the price's position relative to the moving average line, can empower you to decide whether to profit from a bullish or a bearish trend.
Upward slope with price above the moving average. This scenario strengthens the uptrend signal. It suggests that closing prices are consistently higher than the average price over the chosen period, indicating strong buying pressure and potential for continued upward movement. The steeper the slope, the more aggressive the uptrend will tend to be.
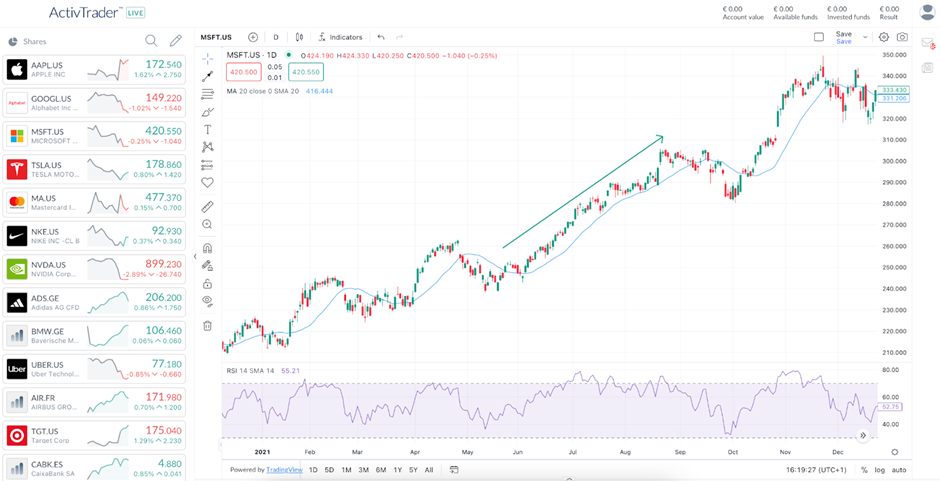
Daily Chart of Microsoft with a 20-day Simple Moving Average - Source: ActivTrader
Upward slope with price below the moving average. While the upward slope suggests an underlying uptrend, the price being below the moving average indicates a potential pullback or consolidation phase within the uptrend. This could be an opportunity for entry for some traders, anticipating the price to eventually rise and cross above the moving average again.
Downward slope with price below the moving average. This confirms a downtrend. The price staying consistently below the moving average indicates selling pressure and potential for further price declines. The steeper the slope, the stronger the downtrend.
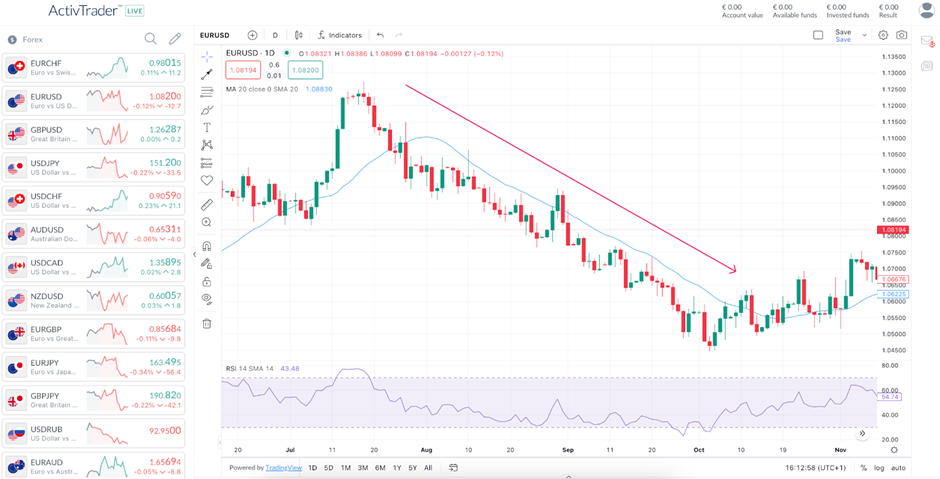
Daily Chart of the EUR/USD with a 20-day Simple Moving Average - Source: ActivTrader
Downward slope with price above the moving average. While the slope suggests a downtrend, the price being above the moving average indicates a possible short-term bounce or resistance level. This could be a potential selling opportunity for some traders, anticipating the price to eventually fall back below the moving average and continue its downward trend.
Flat line: A flat moving average with the price fluctuating around it suggests a consolidation phase. The price is neither definitively trending up nor down, indicating a period of indecision in the market. This can be a time for observing price action and other technical indicators before making a trading decision. Usually, the moving average isn’t really relevant as there is no strong trend going on and often acts as a support or resistance level.
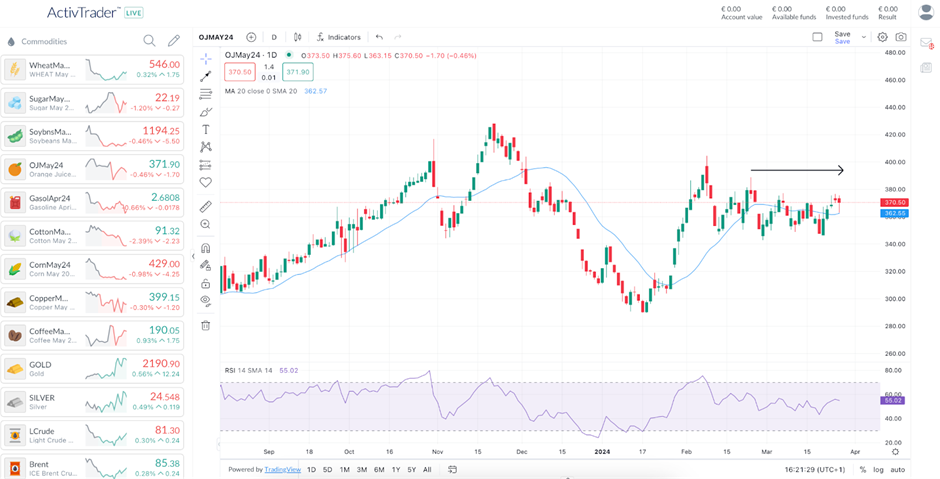
Daily Chart of the Futures on Orange Juice with a 20-day Simple Moving Average - Source: ActivTrader
Moving averages are widely used by traders to identify trends. Their effectiveness lies not just in their ability to smooth out price data, but also in the valuable insights gleaned from the relationship between the moving average's slope and the current price. This ability to identify trends is precisely why moving averages are a critical tool for trend trading.
Trend trading is like surfing the market's waves, where traders aim to catch rides when the market is moving in a clear direction. By understanding the relationship between the moving average's slope and the asset price, you can gain valuable insights into potential trends and position yourself to capitalize on them.
Moving averages are a strong foundation for trend trading, but they're just the first piece of the puzzle. To truly leverage trends, consider incorporating other technical indicators and trading tools into your strategy, such as the following.
Support and Resistance Levels. Imagine the market as a wave encountering an obstacle. Support levels act like the ocean floor, historically halting price declines and causing bounces back up. Conversely, resistance levels are like the ceiling, areas where price increases have been capped in the past. Identifying these zones can help pinpoint potential entry and exit points within a trend.
Average Directional Index (ADX). Not all trends are created equal. The ADX steps in to measure the strength of the current trend, regardless of where the trend is going. This is valuable for filtering out weak, choppy movements and focusing your attention on strong trending opportunities with greater profit potential.
Relative Strength Index (RSI). The RSI helps you gauge whether an asset is nearing an overbought zone (potentially ripe for a pullback) or oversold territory (potentially due for a bounce). In the context of trend trading, this can be used to identify strategic entry points within established trends. Imagine an uptrend – the RSI might indicate an overbought condition, suggesting a potential buying opportunity during a pullback within the overall uptrend.
Chart Patterns. Certain chart patterns suggest that the current trend is likely to continue. These continuation patterns might appear during periods of consolidation within a trend, offering potential entry points for traders who want to ride the ongoing trend. Other chart patterns historically precede trend reversals. By recognizing these reversal patterns, trend traders can anticipate a potential shift in direction and potentially exit their positions before the trend weakens or reverses, or even initiate trades in the opposite direction if the reversal signal is strong. Finally, chart patterns can also offer insights into market psychology.
Trading signals with moving averages
The first way to use moving averages as trading signals within trend trading strategies is by using price crossovers with the indicator. When the price of an asset breaks through a moving average, either upwards or downwards, it can hint at a potential shift in the trend direction. However, it’s important to remember that moving averages are lagging indicators. Moreover, the overall market sentiment and trading conditions matter, as well as recent price movements.
Upward Crossovers. Imagine the price consistently trading below a moving average, then surging higher and decisively crossing above it. This bullish crossover suggests a potential trend reversal from downtrend to uptrend, or the beginning of a new uptrend altogether. Traders might interpret this as a signal to enter long positions (buying the underlying asset) in anticipation of continued upward movement.
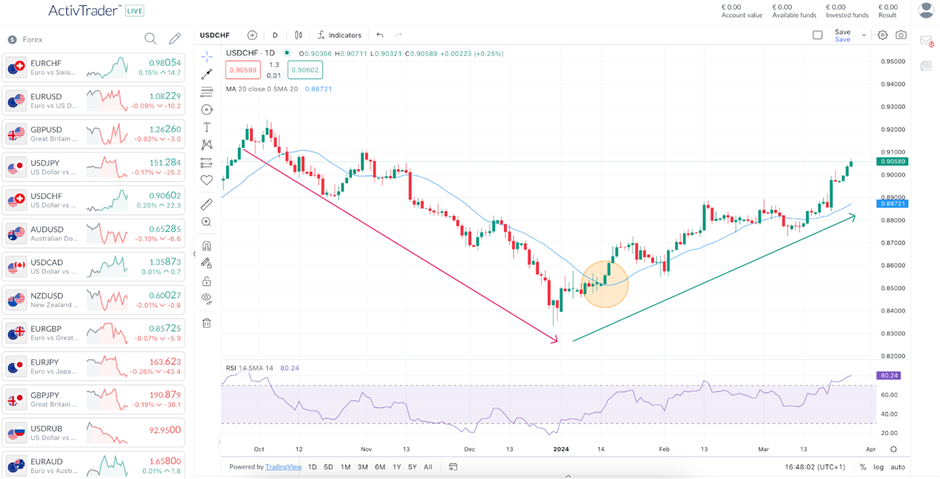
Daily Chart of the USD/CHF with a 20-day Simple Moving Average - Source: ActivTrader
Downward Crossovers. Conversely, if the price is consistently trading above a moving average and then dips below it sharply, this bearish crossover could indicate a potential trend reversal from uptrend to downtrend, or the start of a new downtrend. This might prompt traders to exit long positions (sell) or even initiate short positions through short-selling (borrowing and selling an asset with the expectation of repurchasing it later at a lower price) if the downtrend signal is strong.
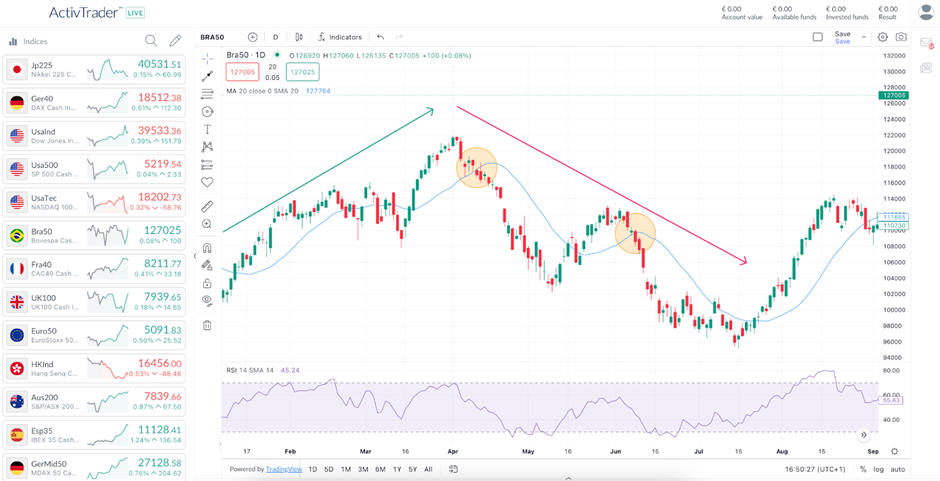
Daily Chart of the BRA50 with a 20-day Simple Moving Average - Source: ActivTrader
Another approach to using trading signals with moving averages entails employing the crossover of different moving averages as indicators for potential buying or selling opportunities in the market.
Typically, traders seek instances where a shorter-term moving average intersects above or below a longer-term moving average. A prevalent strategy involves utilizing a shorter-term moving average, such as the 50-day, in conjunction with a longer-term moving average, such as the 200-day.
The golden cross. When the shorter-term moving average decisively cuts through the long-term average from below and continues to rise above it, a golden cross emerges a\nd signals the confirmation of a bullish trend reversal or the beginning of a strong uptrend.
Why is the golden cross so important for trend traders?
The short-term average crossing above the long-term one suggests a shift in momentum. The shorter average reflects more recent price action, and its sustained rise above the long-term average indicates a potential increase in buying pressure and bullish sentiment. Traders might view this as a green light to enter long positions (buying the asset) in anticipation of continued upward movement.
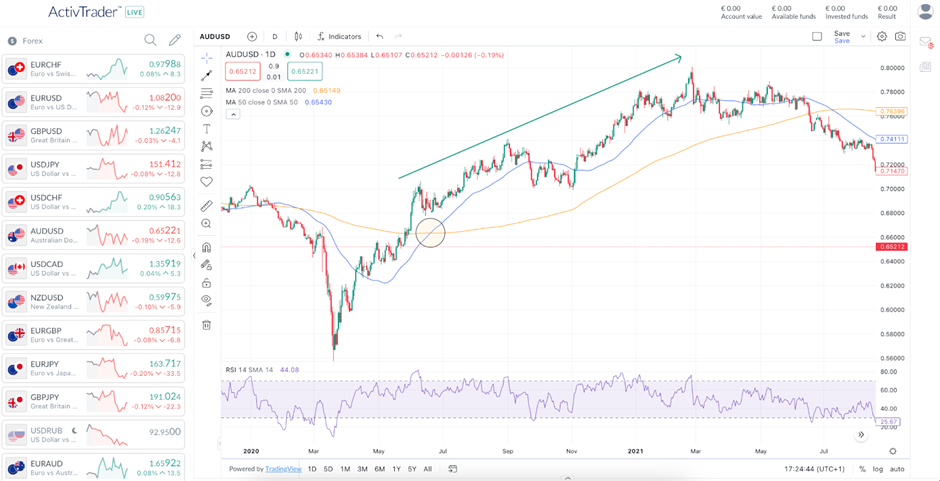
Daily Chart of the AUD/USD with a 50-day Simple Moving Average in blue and a 200-day Simple Moving Average in orange - Source: ActivTrader
The death cross. Conversely, the death cross occurs when the short-term moving average dives below the long-term moving average from above and continues to trade lower. This is often seen as the confirmation of a bearish trend reversal or the start of a downtrend.
The death cross is important, as it suggests a loss of momentum to the upside.
The short-term moving average dipping below the long-term one indicates a potential decrease in buying pressure and a growing dominance of sellers in the market. Traders might interpret this as a signal to exit long positions (sell) or even initiate short positions if the downtrend signal is strong.
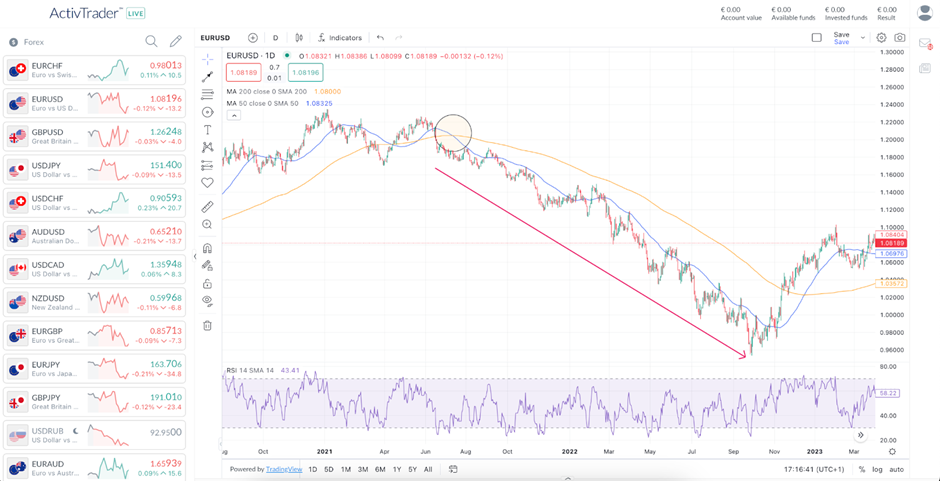
Daily Chart of the EUR/USD with a 50-day Simple Moving Average in blue and a 200-day Simple Moving Average in orange - Source: ActivTrader
Final word
Although they offer valuable insights into trend identification and potential trading signals, moving average’s delayed response to price movements poses a significant limitation. You should always think of them as a compass: while they provide a general direction, sudden shifts can cause them to lag behind.
It’s also important to remember that different moving average lengths provide different perspectives and you need to take that into consideration in your analysis. Usually, short-term moving averages are more sensitive to price changes and generate more frequent signals, while long-term moving averages are less reactive and provide smoother trend confirmation.
To effectively navigate the complexities of the financial markets with moving averages, “responsible application” is essential, which involves using moving averages in conjunction with other technical indicators, such as the Relative Strength Index (RSI) or the Ichimoku cloud, and chart patterns, such as triangles, rectangles and double tops, which offer different perspectives.
Additionally, some investors like to incorporate fundamental analysis, which considers factors like company financials, company guidance, financial and accounting ratios, as well as other economic data depending on the markets you’re trading (Forex, shares, indices, cryptocurrencies, ETF, commodities, bonds…), as this provides a more comprehensive understanding of market dynamics.
By recognizing the nuances of moving averages and strategically using them alongside other tools in your trading strategy, you can elevate them from a basic indicator to a powerful asset in your trading arsenal. This will also help you to navigate the ever-changing market landscape with increased confidence.
The information provided does not constitute investment research. The material has not been prepared in accordance with the legal requirements designed to promote the independence of investment research and as such is to be considered to be a marketing communication.
All information has been prepared by ActivTrades (“AT”). The information does not contain a record of AT’s prices, or an offer of or solicitation for a transaction in any financial instrument. No representation or warranty is given as to the accuracy or completeness of this information.
Any material provided does not have regard to the specific investment objective and financial situation of any person who may receive it. Past performance is not a reliable indicator of future performance. AT provides an execution-only service. Consequently, any person acting on the information provided does so at their own risk.