
Moving averages have been used by traders around the world for some time now, offering a window into the underlying trends that drive market movements. But for some traders and analysts, this ubiquitous indicator remains a double-edged sword – a source of both valuable insights and frustrating ambiguity. This guide is designed to bridge that gap to help you unlock the full potential of moving averages.
We'll explore how it smooths out price data, revealing the essential trend direction – a crucial skill for any trader, especially if you’re looking at identifying potential turning points in the market to take advantage of them. It will therefore allow you to anticipate future price movements and make potential more informed trading decisions.
But moving averages don't stop at mere trend identification! We'll delve deeper, uncovering how to leverage them to profit from potential trading signals. By understanding the interplay between different moving averages and their interactions with price action, you’ll gain the confidence to pinpoint optimal entry and exit points for your trades.
We'll also talk about how moving averages can be seamlessly integrated into your existing technical analysis toolbox. Whether you favor chart patterns or rely on trading indicators, moving averages can provide a complementary perspective that can enhance the overall effectiveness of your trading strategy.
What are moving averages? An easy comparison with the weather
To easily understand moving averages, let’s imagine that you're monitoring the daily temperature throughout a week. But because each day, the temperature may fluctuate significantly, making it challenging to discern the overall trend, using a moving average can be useful.
Rather than solely focusing on today's temperature, the moving average considers the average temperature over a specified number of days, such as the previous 5 or 20 days, which helps to mitigate the daily fluctuations and unveils the broader warming or cooling trend.
In the realm of the financial markets, a moving average serves a comparable purpose but with prices instead of temperatures. Therefore, it computes the average price of a financial asset over a selected period, such as 5 days or 20 days, smoothing out short-term fluctuations and indicating the underlying trend: upward, downward, or flat.
By smoothing out the price data you’re analyzing through the continuous generation of an updated average price, this indicator can be useful to traders seeking to grasp the overarching market dynamics and potentially identify opportune moments for buying or selling a given asset.
Understanding the different types of moving averages
There are different types of moving averages that differ in how much weight they give to recent prices, so let’s have a look at them with the same weather approach to better understand the differences.
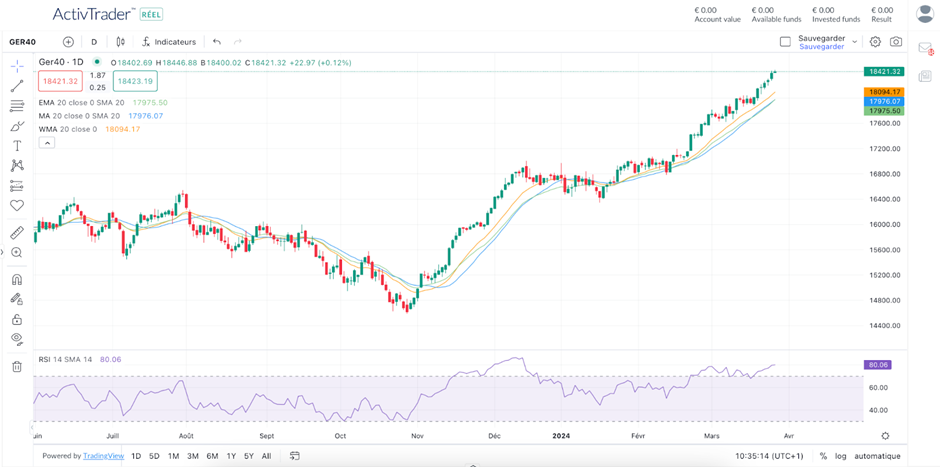
Daily Chart of the Dax 40 with a 20-day Simple Moving Average in blue, a 20-day Weighted Moving Average in orange and a 20-day Exponential Moving Average in green - Source: ActivTrader
Simple Moving Average (SMA). It is like the temperature example we talked about, as it adds up the closing prices for a chosen period (such as 5 or 20 days) and divides by that number. Therefore, every price point has the same weight. So, the most recent price and the price from 5 or 20 days ago contribute equally to the computation of the moving average.
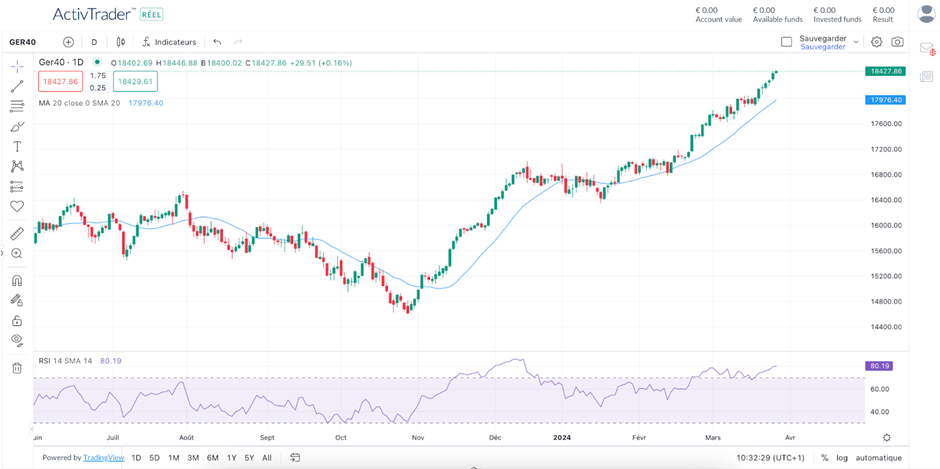
Daily Chart of the Dax 40 with a 20-day Simple Moving Average - Source: ActivTrader
Pros and cons of SMA. This type of moving average is the easiest to understand and calculate, making it a great choice for beginners. It also offers a clear visualization of the average price over a chosen period on your chart. However, this simplicity comes at a cost. Because it treats all prices within the period equally, the SMA can be slow to react to recent price changes. This can be a disadvantage in some market conditions, such as during volatile times where prices can move quickly. So, while the SMA provides a solid foundation for understanding trends, it might miss out on capturing some potentially profitable opportunities due to its delayed response to recent market movements.
Weighted Moving Averages (WMA). While a simple moving average treats each day's temperature equally, what can you do if you want to give more weight to recent heat waves or sudden cold snaps? That's where weighted moving averages come in.
Let's have a look at a 5-day weighted moving average, where recent temperatures hold more weight in reflecting the current trend. Think of it like a weather forecaster giving more importance to the most recent weather data. For this example, the most recent day's temperature will be given the most weight at 5 , followed by decreasing weight for the days before it (4, 3, 2, and 1).
You will then have to multiply each day's temperature by its corresponding weight and add all the resulting values from these multiplications. Finally, divide that sum by the total weight of all the days combined (5 + 4 + 3 + 2 + 1 = 15).
This average will give more weight to the most recent high temperatures, creating a smoother trend line compared to a simple average, where all days have equal weight. This approach helps us understand the general warming or cooling trend over the past few days, rather than just focusing on each day's individual highs — and the same applies to the financial markets.
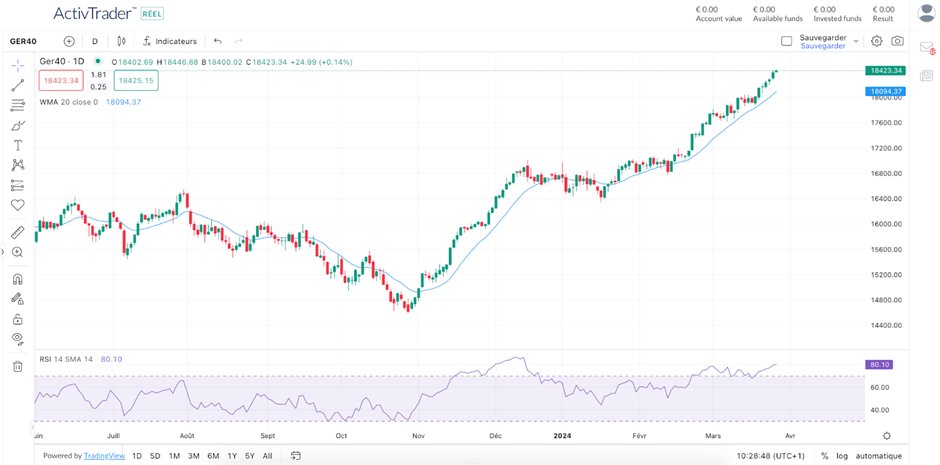
Daily Chart of the Dax 40 with a 20-day Weighted Moving Average - Source: ActivTrader
Pros and cons of WMA. By using weighted moving averages, you can gain a better understanding of the overall price movements in the markets. They also react faster to recent changes compared to a simple average, where all days have equal weight. This allows for a more nuanced understanding of the trend's direction and potential turning points. However, they can be more volatile than SMW, especially with very high weights on recent data, potentially creating misleading signals if short-term fluctuations are significant.
Exponential Moving Average (EMA). This average offers a nuanced approach to smoothing price data compared to the other moving averages, as it assigns greater weight to more recent data points through a smoothing multiplier, typically calculated as [2 ÷ (number of observations + 1)]. This essentially determines the decay rate of the weight given to past prices. In this way, the formula ensures past price data still contribute but with a diminishing influence as we go back further in time.
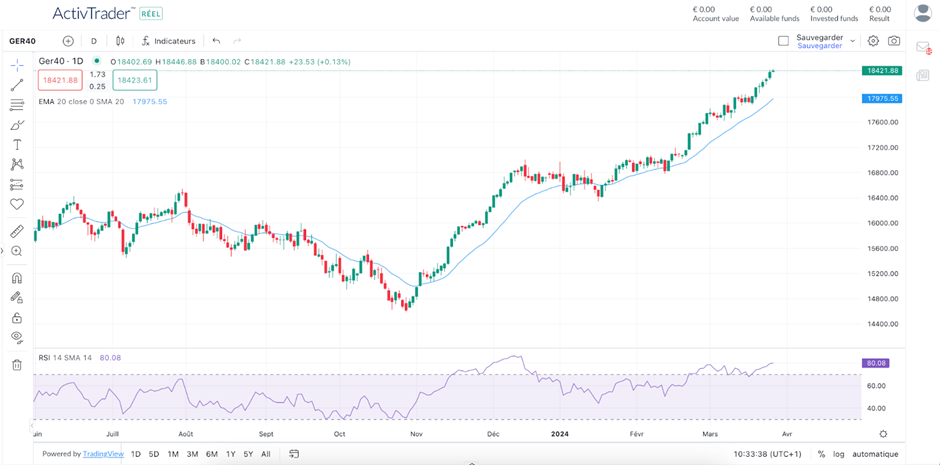
Daily Chart of the Dax 40 with a 20-day Exponential Moving Average - Source: ActivTrader
Pros and cons of EMA. Because this moving average puts more emphasis on recent prices, this means that it reacts faster to recent price movements, potentially helping you identify turning points and capitalize on short-term opportunities. However, this responsiveness also means that the EMA can be a bit more jumpy compared to the SMA, as it incorporates recent fluctuations more readily, therefore providing potentially more false trading signals. Additionally, the concept of a multiplier and its role in weighing prices may seem less intuitive than the simple averaging approach of the SMA, especially for beginners.
The information provided does not constitute investment research. The material has not been prepared in accordance with the legal requirements designed to promote the independence of investment research and as such is to be considered to be a marketing communication.
All information has been prepared by ActivTrades (“AT”). The information does not contain a record of AT’s prices, or an offer of or solicitation for a transaction in any financial instrument. No representation or warranty is given as to the accuracy or completeness of this information.
Any material provided does not have regard to the specific investment objective and financial situation of any person who may receive it. Past performance is not a reliable indicator of future performance. AT provides an execution-only service. Consequently, any person acting on the information provided does so at their own risk.