
My last two articles were all about equity fundamentals, and how traders could use this data to search for and highlight trading opportunities and setups.
Prior to that, I had written about how a systematic approach to the markets could surface opportunities, even if you knew very little (or even nothing) about the underlying instruments that this process brought to light.
One of the stocks that I used as an example in the article Trading Ripples was Teradyne TER US.
We can see the percentage change in the price of Teradyne, over 1-month (LHS) and 1-week (RHS) in the charts below.
Teradyne has risen by approximately +10.00% since I featured it in the article, and by more than +18.00% since I first flagged it, in one of the Trading discords that I contribute to, back on December 4th.
Teradyne 1-month and 1-week percentage price change
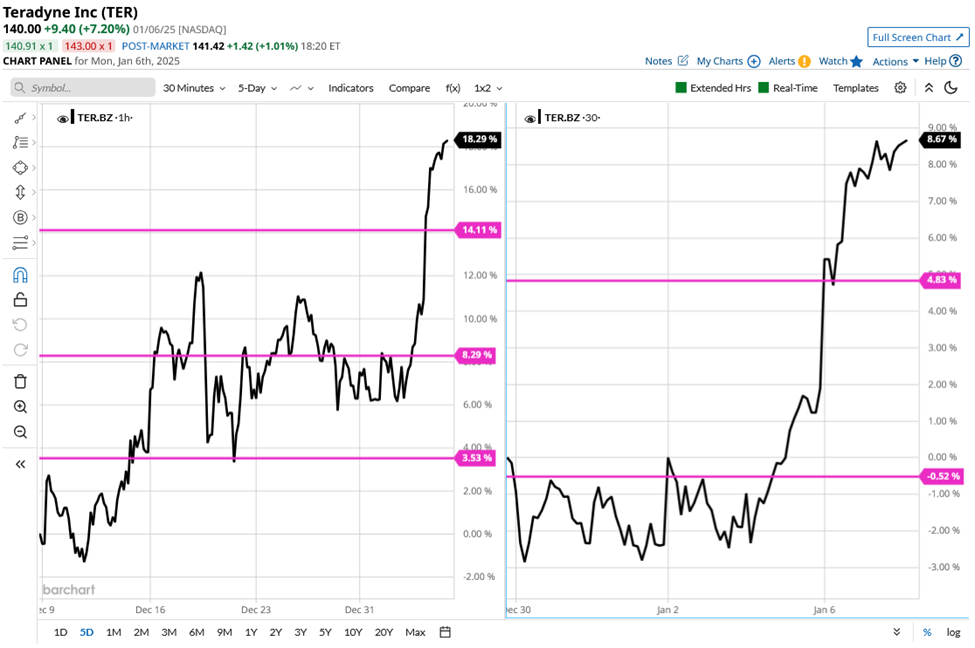
Source: Barchart.com
This isn't just an exercise in self-congratulation, though of course it's nice to be proven right. Rather, I wanted to emphasise what's possible using different sorts of analysis.
Terradyne was surfaced using technical analysis, combined with a smattering of fundamentals and an examination of the price action.
The question then is:
Are there any recent examples, where I have used fundamentals to highlight an opportunity, and then overlaid that with some technical analysis?
Well, as luck would have it there are
If we look back at part one of the article Fundamentals that can aid your trade in 2025 you can see that I shared a table of S&P 500 stocks, with both very high and very low PE ratios.
Among those with a low PE ratio were two Energy stocks:
APA Corp APA US and Devon Energy DVN US.
In the week since I wrote the article, Devon Energy has added +8.10% and APA Corp has put on just over +7.00%.
Devon Energy and APA Corp 1-week % change
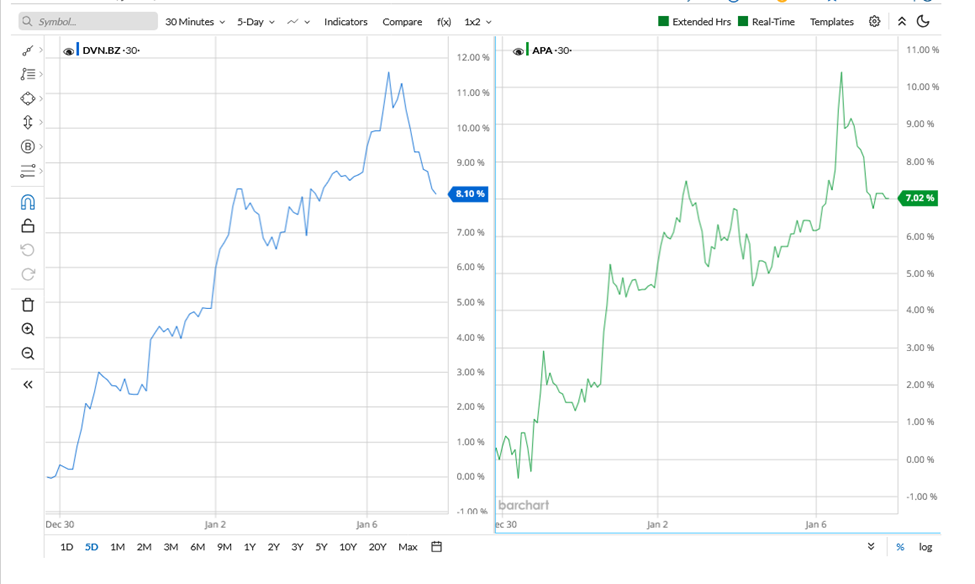
Source: Barchart.com
Combining Fundamentals and Technicals to find a winner
So how exactly could we have combined the fundamentals and technicals in Devon Energy and APA corp to confirm these trading opportunities?
Interestingly I wrote about doing just this sort of thing way back in May 2023, in the article How traders can make use of sector performance data, in which I described the use of the 20-day MA percentage indicator.
A metric which measures the percentage of stocks within a sector or index that are trading above their 20-day Moving Average, and thus, acts as a barometer of market sentiment.
The sector I picked to illustrate the use of the indicator in May 2023 was the S&P 500 Energy sector.
If you haven't read this article. Or read it recently, can I suggest you click through on the link above and do just that.
What was true then is true today
To illustrate what I am talking about, here is the chart, and the HLOC (High, Low Open,Close) data of the S&P 500 Energy sector 20-day MA percentage.
As we can see in mid to late December (highlighted on the chart in red) the indicator moved down and settled close to zero %.
However it didn't stay there.
The 20-day MA % started to rally ahead of the holidays, and by December 26th, it had moved up to 9.09%.
It doubled in value the following day and by the close on January second, the first trading day of the New Year, it had risen to 54.54% and would go on to print at 77.27% on January third.
HLOC of the S&P 500 Energy sector 20-day MA percentage
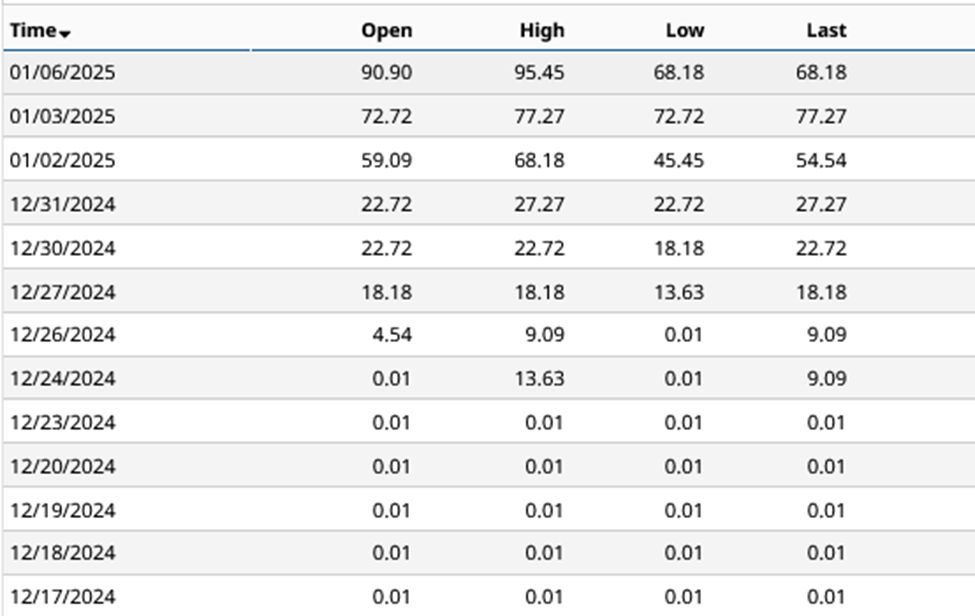
Source: Barchart.com
The bounce in the MA percentage indicator was confirmation that energy stocks were attracting attention.
S&P 500 Energy sector 20-day MA percentage
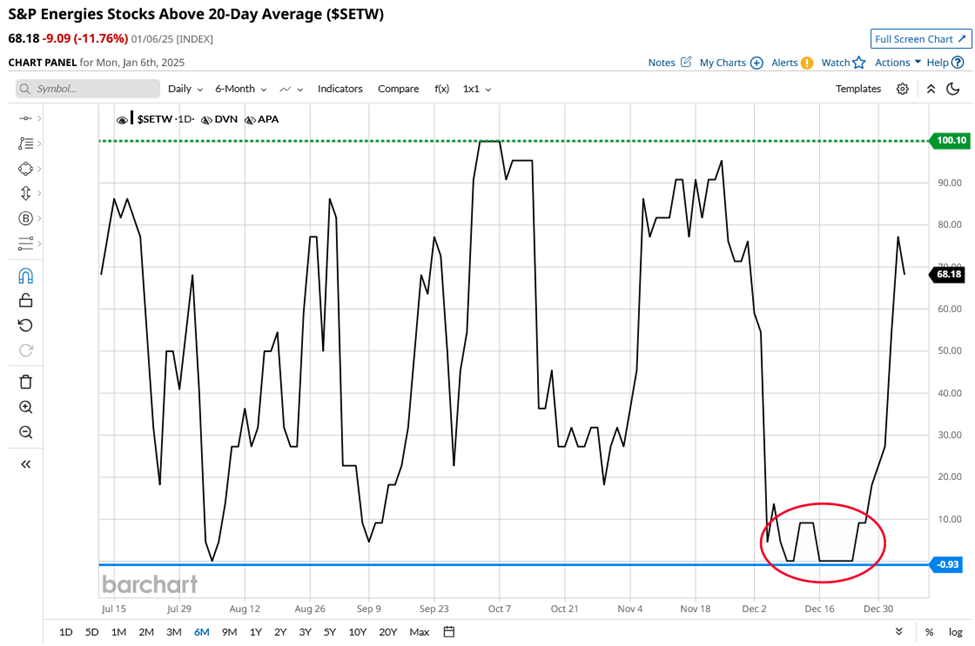
Source: Barchart.com
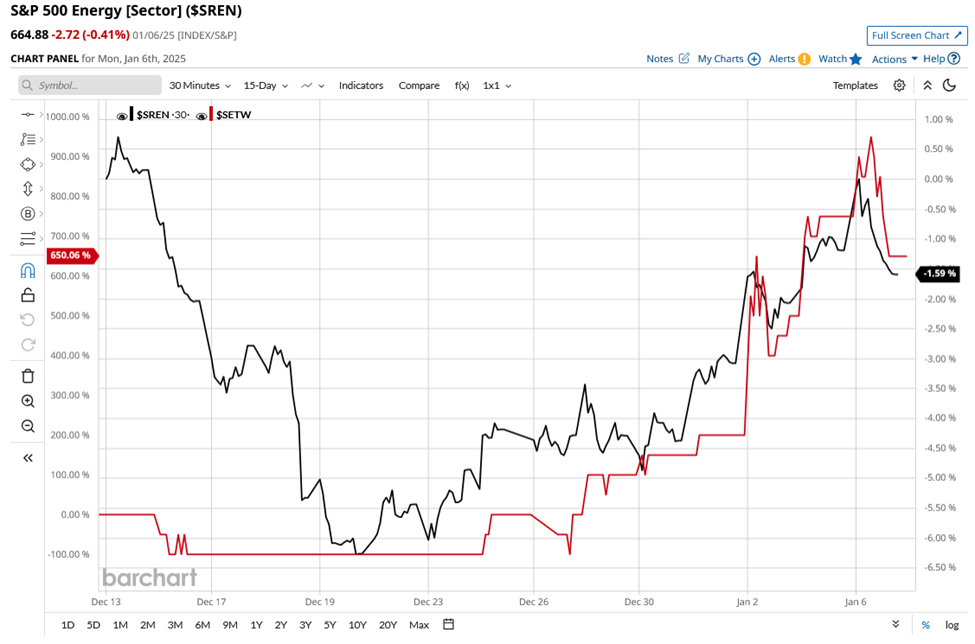
Now let's look at the S&P 500 Energy sector index in black, overlayed by and compared to, the 20 day MA percentage indicator for the sector, drawn in red.
S&P 500 Energy sector and the S&P 500 Energy sector 20-day MA percentage
Source: Barchart.com
We can see that the bounce in the indicator coincides with a +6.00% bounce in the Energy sector index, which was accompanied by a rally in the prices of both APA Corp and Devon Energy.
Coincidence or research driven?
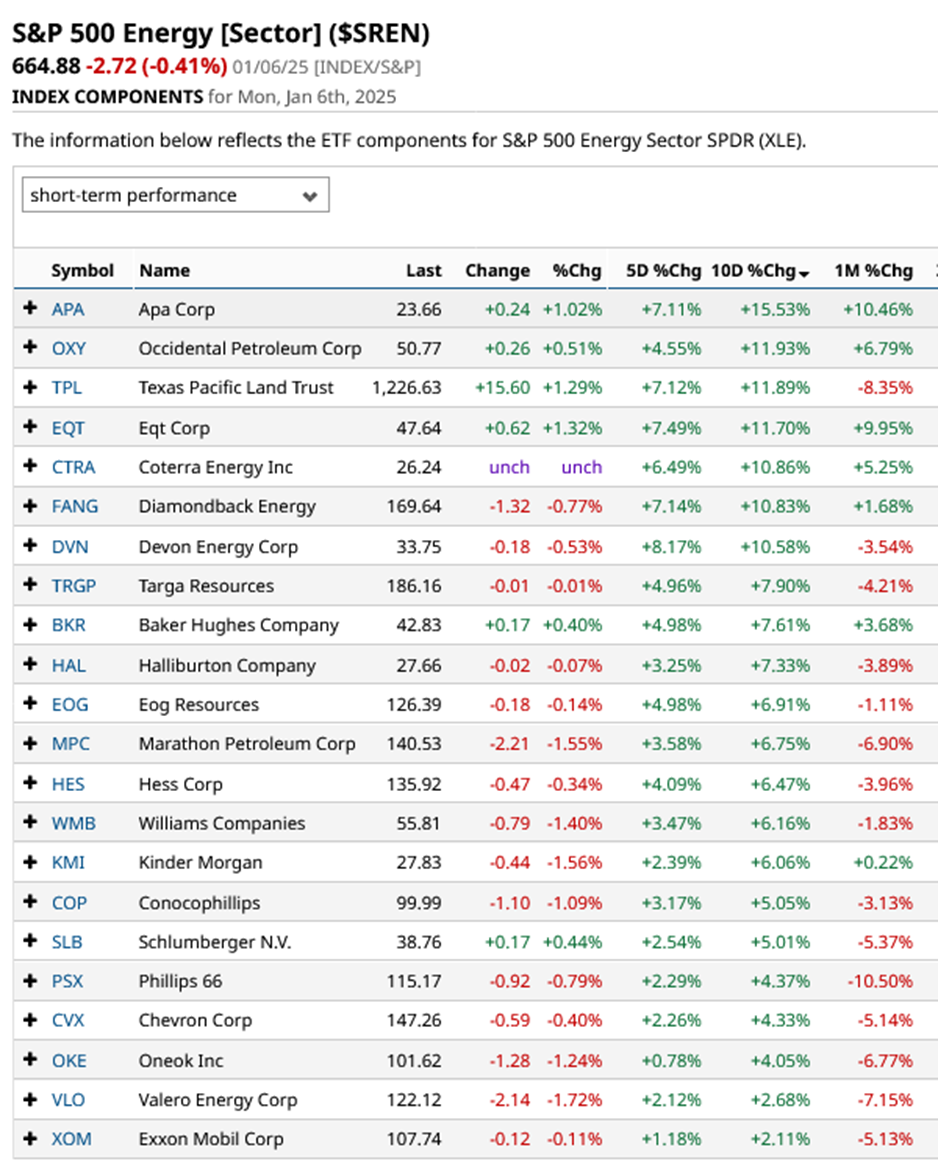
Against this background do I find it surprising that APA Corp leads the S&P 500 Energy sector components, when ranked by short term performance? No I don't
APA is top of the list over both 5 and 10-day % changes, it’s also the top performer over 1 month as well.
S&P 500 Energy sector components ranked by 10-day % change
Source: Barchart.com
I’ll leave you to decide if that outcome is a happy coincidence, or whether it comes about as the result of thoughtful research, using a combination of techniques, and a process (systematic approach) that I believe in, and which was designed to do just this sort of thing.
I think you can guess which of those two alternatives I am backing.
The information provided does not constitute investment research. The material has not been prepared in accordance with the legal requirements designed to promote the independence of investment research and as such is to be considered to be a marketing communication.
All information has been prepared by ActivTrades (“AT”). The information does not contain a record of AT’s prices, or an offer of or solicitation for a transaction in any financial instrument. No representation or warranty is given as to the accuracy or completeness of this information.
Any material provided does not have regard to the specific investment objective and financial situation of any person who may receive it. Past performance is not a reliable indicator of future performance. AT provides an execution-only service. Consequently, any person acting on the information provided does so at their own risk.