
Sometimes the chart is all you need
One of my best calls in 2024 came late in the year, and in stock that I knew nothing about.
Yet that makes it all the better, because it shows that process and rules can be just as valuable as insight and knowledge, if used correctly.
I have subsequently learnt that Ironwood Pharmaceutical IRWD US is a S&P 600 small cap stock that develops treatments for gastro-intestinal issues.
When I first came across the stock I didn’t even know that
IRWD US came in a screen of US small and Mid cap names.
These screens throw up numerous tickers, that have met certain criteria.
For example, posting a new 5 day high, or having had a notable price movement on larger than average volumes. (Ironwood had recently met both of these criteria)
I take these lists and I refine them, if required.
And then I look for interesting charts among the list constituents ,or at least charts that catch my eye.
Ironwood certainly did that on the morning of December 20th, with the price testing above the downtrend line in pink, and closing in on the 50 day MA in green (see below).
The price had failed, and fallen back the last time it tested at these two barriers in the early part of December.
Importantly there was also tangible upside momentum in the stock which had rallied by more than +12.0% the day before.
My intuition was that there could be more to come.......
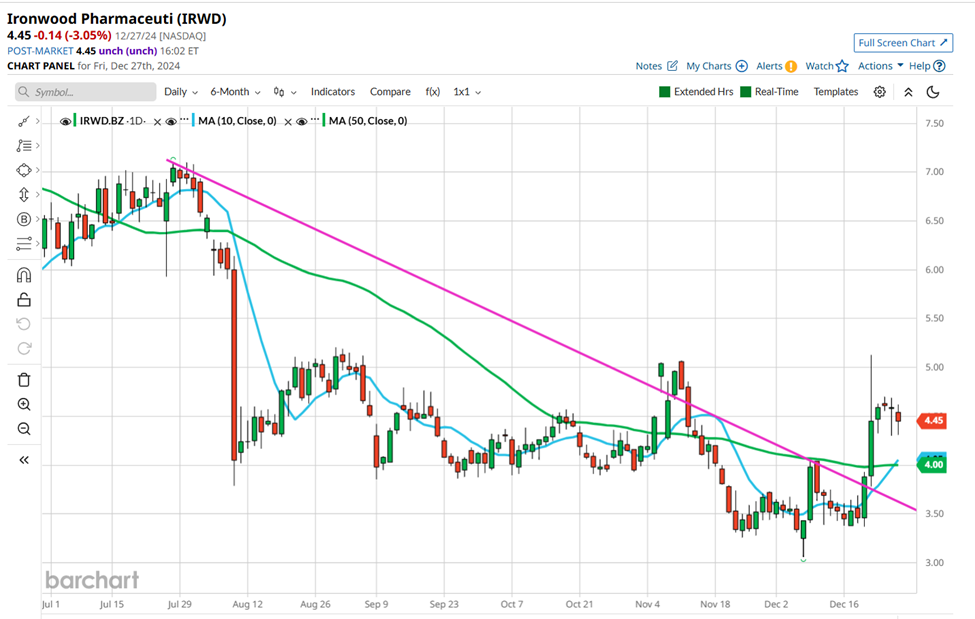
Source: Barchart.com
And so it turned out
In fact, as you can see in the table below, on December 20th, Ironwood traded up by a further +14.69% and added a further +3.15% on Dec 23rd.
But that’s not the whole picture, as far as the price action is concerned, because Ironwood stock printed all the way up to $5.13 on Dec 20th, compared to the opening print of just $3.89. An intraday gain of +32.0%.
IRWD US price performance
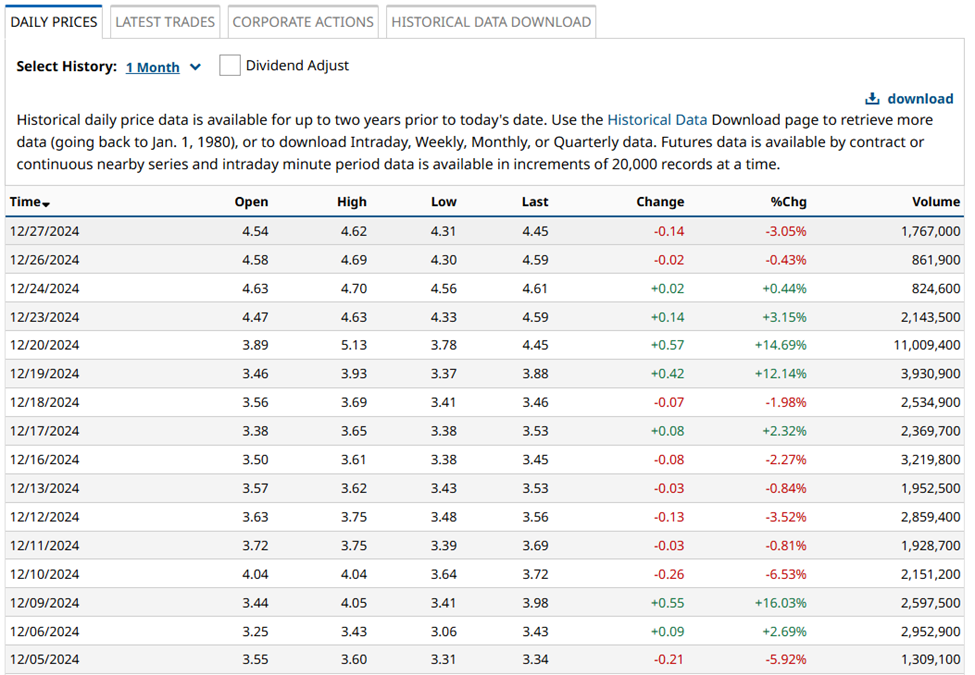
Source: Barchart.com
Trusts your instincts and your process
The lesson I learned (or was reminded of) here is that it’s often right to follow your intuition and your process.
After all, the whole point of screening the market is to identify trading opportunities just like this.
I am not saying that it was definitely possible to capture the whole 30.0% plus intraday move here, but it should have been possible to capture a decent chunk of it.
You need to understand your market and its characteristics, but you don’t always need an intimate knowledge of it.
Purely technical traders will tell you that the chart (price action) can tell you all you need to know about a particular market or instrument.
I am not that much of a purist, I follow a hybrid approach, however I can see where they are coming from when you get situations like this.
Rhyming not repeating
Here is another example of a trading setup that panned out during December in this case it was in Teradyne TER US. A company that makes equipment which tests, and helps automate the production of electronic components and circuits.
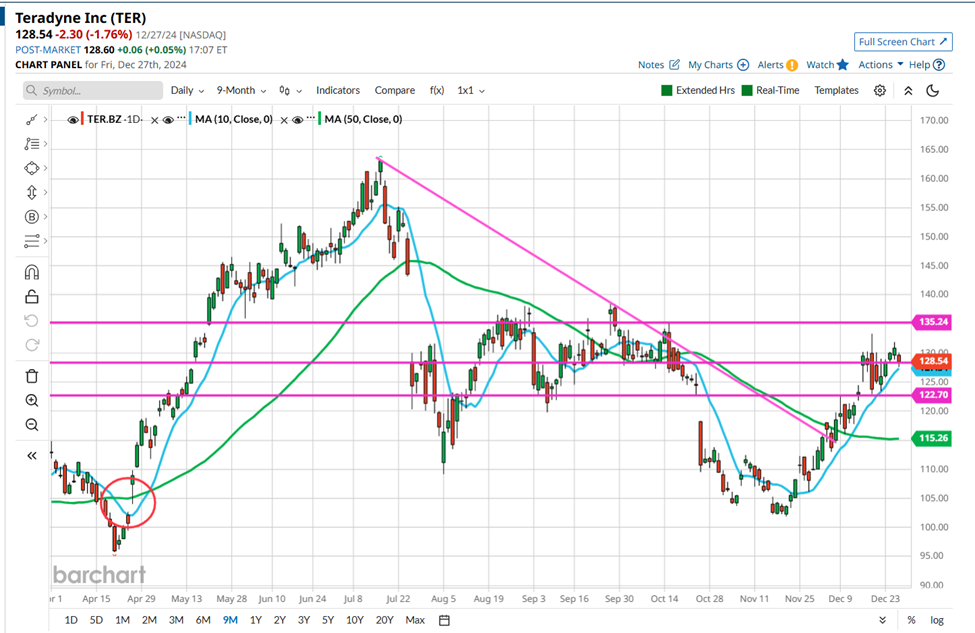
Source: Barchart.com
Teradyne first came onto my radar back in April 2024 you can see they posted an MA crossover before they rallied from around $106.00 all the way to $162.00. So they had “form” if I can put it like that.
So when the stock started to post bullish signals in early December, by for example, testing back towards the downtrend line drawn from the early July highs it got my attention, and I posted that “TER US had caught my eye”
At that time they were trading at just under $116.00 and they would go on to print at $133.00 on December 18th. having once again posted an MA crossover in the process.
So what am I trying to tell you here?
Well, firstly that every trading set up is different, possibly unique. Whether it's in a stock you have never heard of, one you are vaguely familiar with, or even know intimately.
Spotting trading setups is just part of the equation because every trading set up needs a catalyst to set them in motion.
We likely won't know what those catalysts are, or if and when they will appear, however, we may not need to.
I say that because I liken the use of market screens and charts to spotting ripples on a pond.
We may not know what is causing those ripples, and what lies beneath the surface of the water but we can tell that something is moving, and that it could break above the surface.
In this analogy the price action creates the ripples on the pond, which is the surface of the market.
Spotting those ripples means we are in position advantage, as, when and if, their source breaks cover.
But like every good fisherman we need to be patient and vigilant in equal measure, and let the big fish come to us.
The information provided does not constitute investment research. The material has not been prepared in accordance with the legal requirements designed to promote the independence of investment research and as such is to be considered to be a marketing communication.
All information has been prepared by ActivTrades (“AT”). The information does not contain a record of AT’s prices, or an offer of or solicitation for a transaction in any financial instrument. No representation or warranty is given as to the accuracy or completeness of this information.
Any material provided does not have regard to the specific investment objective and financial situation of any person who may receive it. Past performance is not a reliable indicator of future performance. AT provides an execution-only service. Consequently, any person acting on the information provided does so at their own risk.