
I talk a lot about Technical Analysis in my articles and posts, but that's only one of the tools that I use to gauge the market, identify trading opportunities, trend changes and swings in sentiment etc.
And though it doesn't get as much airtime or column inches as TA , particularly among retail traders, Fundamental Analysis has an equally important part to play in this process.
So let’s have a look at some fundamental indicators/ratios that you can use to aid your trading in 2025.
Let's start with a key equity valuation metric the Price Earnings or PE ratio
The P/E ratio indicates how much investors are willing to pay for each unit of a company's earnings.
A higher P/E ratio suggests that investors expect higher earnings growth in the future, while a lower P/E ratio may indicate that a company is undervalued, or that its current earnings are exceeding past trends.
The PE ratio is calculated using this simple sum:
P/E Ratio = Current Stock Price / Earnings Per Share (EPS)
You probably won’t ever have to calculate a PE ratio from scratch however, because this information is freely available for nearly all stocks - And of course stocks that don’t produce earnings don't have a PE ratio.
The PE ratio allows a trader to compare stocks to each other, or more specifically to compare the valuation of a stock or a group of stocks, with each other, and their index or sector.
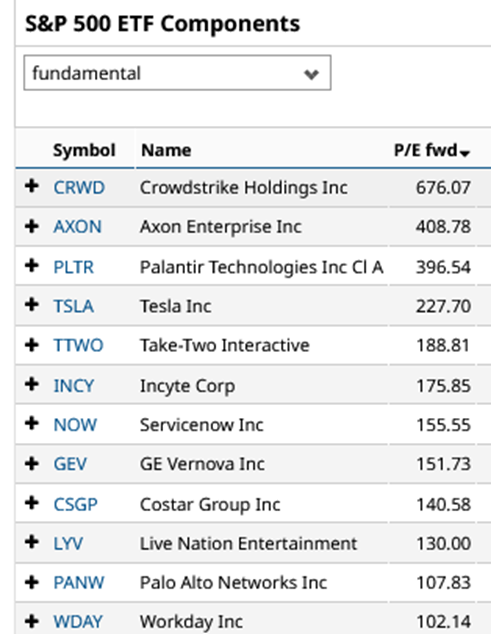
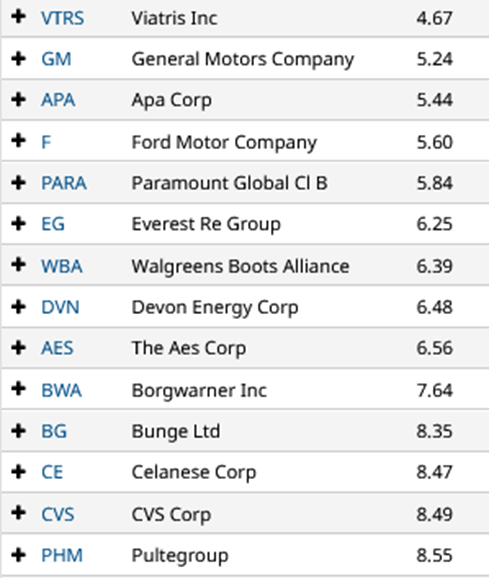
The table below show stocks within the S&P 500 index that have the highest and lowest PE ratios (ignoring those that don't currently have a PE ratio)
As we can see stocks such as Crowdstrike CRWD and Palantir PLTR have extremely high Forward PE ratios.
The forward PE ratio is simply an estimate for the stocks PE ratio over the next 12 months.
As opposed to the Trailing Twelve Months or TTM PE ratio which is a measure of historical PE ratios.
The likes of APA Corp APA. General Motors GM and Ford F, in the lower table, have low forward PE ratios.
To give these ratios some context, and to provide a framework against which to judge them, it might be useful to know what the PE ratio is for the S&P 500 is..
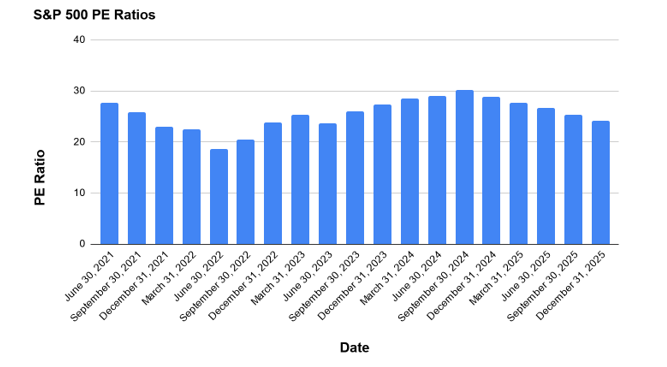
We can do better than that, because we can view the forward and historical PE Ratios for the index from June 2021 out to December 2025.
Currently the S&P 500 trades on a PE of 28.92 times earnings that’s estimated to fall to 24.19 by end December 2025.
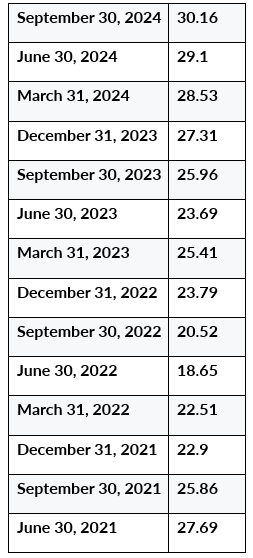
Source: Ycharts.com
Source: Ycharts.com/Darren Sinden
That lower Forward PE ratio suggests one of two things will happen
Either S&P 500 earnings are going to rise over the next 12 months,or stock prices are going to fall.
The expectation is that earnings will grow, and grow at a much faster rate than average.
With Wall Street analyst’s estimating an EPS growth rate, for the S&P 500, stocks of +14.80% in 2025 versus the 10 year average growth rate of +8.0%.
That’s bullish isn’t it?
After all higher earnings means higher multiples or forward PE ratios / prices for S&P 500 stocks are justified aren't they?
The answer to that is possibly
Because we have to consider two factors: Firstly markets are forward looking and so, some if not all of that earnings growth will be priced in already.
Secondly, estimates are just that, and, until companies start reporting, we can't be sure that above average earnings growth will be delivered in 2025.
However we will get some insight from the final earnings season of 2024, which kicks off in Mid January.
Expectations for Q4 2024 are for EPS growth of +11.90%.
If the S&P 500 constituents deliver that level of earnings growth, or more, in Q4 2024 earnings season then that’s a good omen for 2025, but if not then.
In the second part of this article we will look at some other fundamental indicators and how they can be combined to and used to identify potential trading opportunities.
The information provided does not constitute investment research. The material has not been prepared in accordance with the legal requirements designed to promote the independence of investment research and as such is to be considered to be a marketing communication.
All information has been prepared by ActivTrades (“AT”). The information does not contain a record of AT’s prices, or an offer of or solicitation for a transaction in any financial instrument. No representation or warranty is given as to the accuracy or completeness of this information.
Any material provided does not have regard to the specific investment objective and financial situation of any person who may receive it. Past performance is not a reliable indicator of future performance. AT provides an execution-only service. Consequently, any person acting on the information provided does so at their own risk.