
In my recent article about top-down and bottom-up approaches to analysing the markets, I concluded by saying that using a blend of the two disciplines was probably the most effective way, to find and highlight trading opportunities and setups.
That hybrid approach can be extended to cover other forms of analysis, which is what I do when I am researching or screening the markets looking for ideas or points of interest.
That can act as indicators, or evolve into outright trading opportunities themselves.
To do this I try and take the best parts of two or three forms of analysis and put them together to create a systemised workflow.
I don't always stick to the same recipe, after all, markets are fluid and dynamic, so your approach to them needs to be flexible.
However, in general, I am looking for instruments that have the potential to move in price, and ideally an idea of what catalysts that could drive those price changes, are.
The two principal forms of analysis I use are Technical and Fundamental
Technical analysis is a method of evaluating securities by analysing statistical patterns and trends in their price movements alongside other market-related data, such as trading volumes and open interest.
Technical analysis is used by traders to highlight potential trading opportunities, based on factors such as repetitive patterns in a chart, support and resistance levels, and the interaction of price with, and response to, various indicators.
Technical analysis is based on the assumption that prices move in trends and that these trends can be identified and followed, to make profitable trading decisions.
Chart patterns, such as a head and shoulders, triangles, and wedges, are used to identify potential reversals or continuations of trends.
A chart of Intel (INTC) drawn with technical indicators, in this case moving averages and RSI 14 and horizontal support and resistance lines.
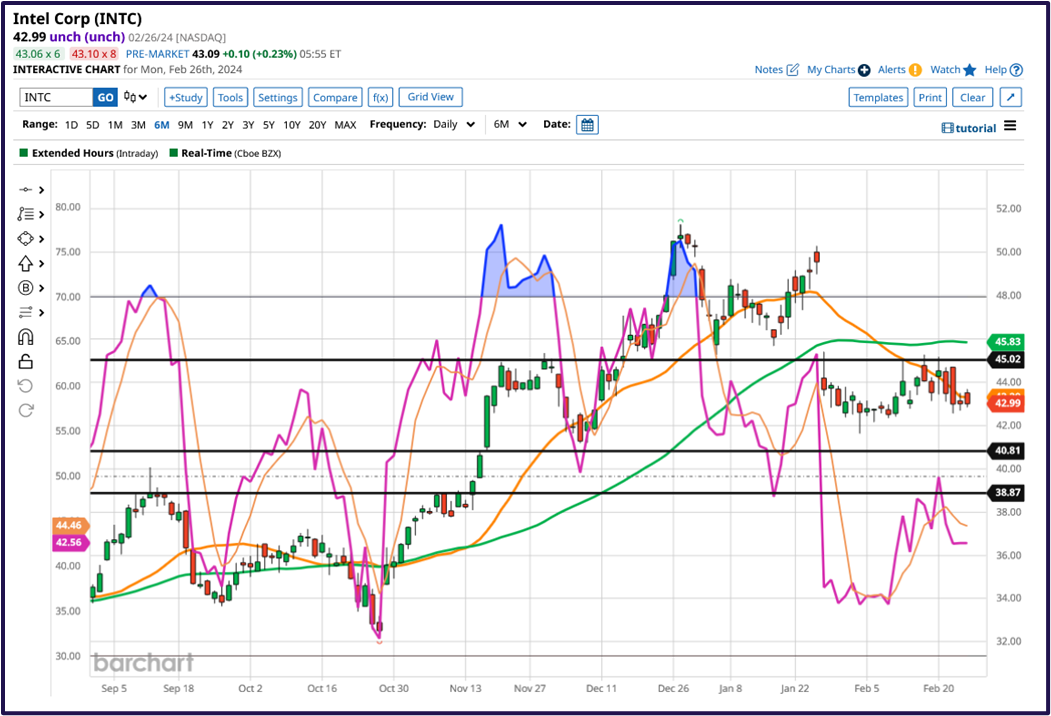
Source: Barchart.com
Trend lines can be used to identify support and resistance levels, the direction of travel, and the path of least resistance in the price action, which can help traders identify optimal entry and exit points.
Technical indicators, such as moving averages, the relative strength index (RSI), and Bollinger bands, can confirm trends and identify trading opportunities, such as breakouts or trend reversals.
Technical analysis or TA can be used for short-term trading, such as day trading, or long-term investing.
It can be applied to most markets, including stocks, futures, forex, bonds and commodities.
Critics argue that Technical Analysis is not a reliable way to analyse the markets or forecast future prices, likening it to a form of mysticism.
Whilst staunch advocates of TA maintain that the chart contains all of the information that you need to know, to be able to trade the market.
The truth as ever lies somewhere in between those two extremes.
The charts on which Technical Analysis is based, capture trading sentiment, and it is necessary to interpret that sentiment, to derive any benefit from it.
That said whilst history doesn't necessarily repeat itself - it does tend to rhyme with the past.
And that look-alike repetition is meat and drink to technical analysts and traders alike.
A fundamental approach
Fundamental analysis is a method of evaluating securities by analysing a company's financial statements and ratios, its management team, industry trends, and overall economic conditions.
It is a comprehensive approach that aims to estimate a company's intrinsic value and the potential for future growth and price appreciation.
Fundamental analysis is often used by investors who are looking for long-term investment opportunities, as opposed to short-term trading, however fundamental analysis can be utilised by even short-term traders.
The process of fundamental analysis often begins with a review of a company's financial statements, such as the balance sheet, income statement, and cash flow statement.
Analysts look for key financial ratios, such as the price-to-earnings ratio, dividend yield, and debt-to-equity ratio, to assess a company's financial health and performance.
They may also evaluate the company's management team, examining their track record, leadership style, and experience in the industry.
A table of select Dow 30 components and some of their fundamental data.

Source Brachart.cm
In addition to the analysis of financial statements, fundamental analysts can also consider industry trends and overall economic conditions.
They may assess the company's market position, competitive advantages, and potential risks and evaluate the company's business model, examining its revenue streams, profit margins, and cost structure.
Most traders wont go into this much detail, however, preferring instead to conine themselves to the type of ratios, displayed in the table above.
Fundamental analysis is considered a bottom-up approach, meaning that it focuses on the individual company's fundamentals rather than macroeconomic factors. It can be a time-consuming process and, in some cases, it can require an understanding of accounting, finance, and industry trends.
The goal of fundamental analysis is to estimate a company's intrinsic value, which is the true value of the company rather than its market cap and share price.
By comparing the intrinsic value to the current market price, traders aim to determine if the stock is undervalued, overvalued, or fairly valued.
In the second article on this topic, we will look at how you can apply a blend of technical and fundamental analysis to highlight trading opportunities.
The information provided does not constitute investment research. The material has not been prepared in accordance with the legal requirements designed to promote the independence of investment research and as such is to be considered to be a marketing communication.
All information has been prepared by ActivTrades (“AT”). The information does not contain a record of AT’s prices, or an offer of or solicitation for a transaction in any financial instrument. No representation or warranty is given as to the accuracy or completeness of this information.
Any material provided does not have regard to the specific investment objective and financial situation of any person who may receive it. Past performance is not a reliable indicator of future performance. AT provides an execution-only service. Consequently, any person acting on the information provided does so at their own risk.