
In the first of the articles on “Fundamentals that can aid your trade in 2025”.
We looked at the concept of the PE or price earnings ratio, and how that number varies between stocks, and in comparison to index or sector multiples.
We established that a higher rate of earnings growth/earnings is directly related to higher PE ratios or multiples, and therefore higher equity prices.
We also noted that the equity market is forward looking, and on that basis, expectations of earnings growth may already be priced in.
Additionally we stated that Forward PE ratios are estimates, and nothing more. Meaning that we can’t know just how well a company's underlying business is performing, until it reports its earnings.
A very valuable and very useful comparative tool
Nonetheless, the PE ratio remains a very valuable, and very useful comparative tool for traders,who can use it to make comparisons between stocks, and to judge or quantify market sentiment towards them.
Just like stock prices, PE ratios and investor sentiment, can and does swing from bearish to bullish, and back again, moving closer to, or away from sector and index PE averages on the way.
We can use the PE ratio to look for trading opportunities on both the long and short side, by say, screening for stocks that have a Forward PE ratio that's well above, or well below, the index multiple. Which for the S&P 500 currently is 28.92 times.
For example, the chart below shows those S&P 500 stocks which have a forward PE ratio of 14.50 times or lower - that’s one half, or less, of the S&P 500 Forward PE ratio.
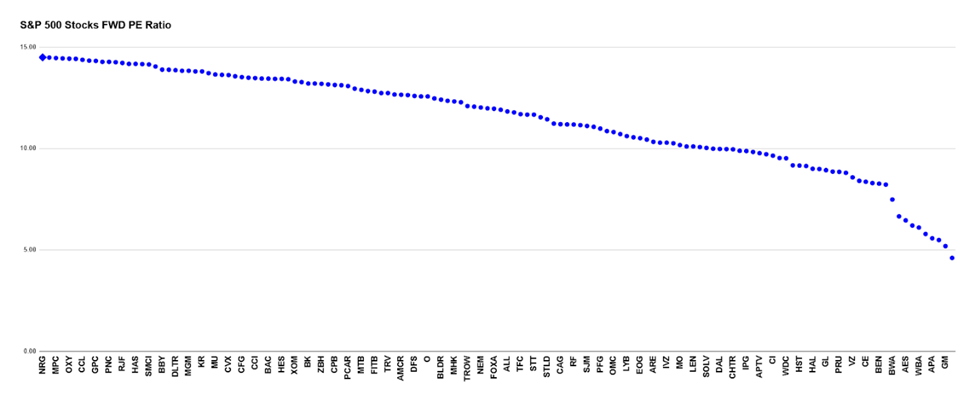
Source: Darren Sinden
A long list
There are 138 stocks that meet this criteria, by compression there are 115 stocks with a Forward PE ratio that's greater than the S&P 500 PE ratio. And 22 stocks that are trading at twice the S&P 500 PE or higher.
Let’s focus on upside opportunities.
Do we want to sift through 138 charts looking for trade setups?
I certainly don't, added to which having a significantly lower than average PE ratio doesn't necessarily make a stock a longside opportunity. In fact. In many cases the exact opposite can be true.
So to shorten the list, and make it more meaningful, we need to add in a qualitative screen.
We started this article talking about earnings, so let’s continue in a similar vein, and use 5-year earnings growth as our qualitative screen.
Why?
Well because we want to look for stocks that have been “unfairly or overly discounted “ or in other words marked down, but which still have a reason to interest traders and investors.
A consistent record of earnings growth, over five years, is just such a hook .
We can accomplish all of this by filtering a table of the fundamentals of S&P 500 stocks in a spreadsheet.
That might sound complicated, but we can either download the data as a CSV file, or copy and paste a table of data into a spreadsheet, depending on what your systems allow.
I used a custom view of the S&P 500 stocks in Barchart.com, a sample of which is shown below.
I downloaded the data, opened it as google sheet and then sorted and filtered it as required,using the auto filter function.
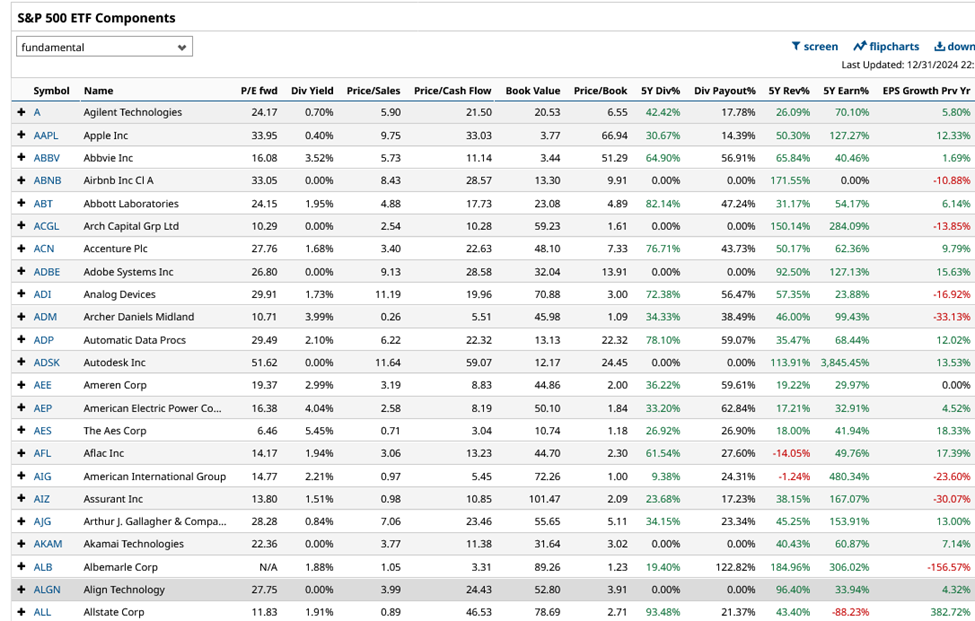
Source: Barchart.com
Earnings growth rates
The average 5-year earnings growth rate among the 138 stocks with a forward PE <= 14.50 times is +70.56%.
However we can go a step further, and look at their EPS growth record over the prior year, which averages out at +20.43%.
Applying the 5-year earnings growth screen, trims the list down to a more manageable 41 names.
If we look at this reduced list and sort it highest to lowest, by 5 year earnings growth, we find that insurer Everest Re Group EG US, has the best track record, with a 5 yr EPS growth rate of +1327.0%.
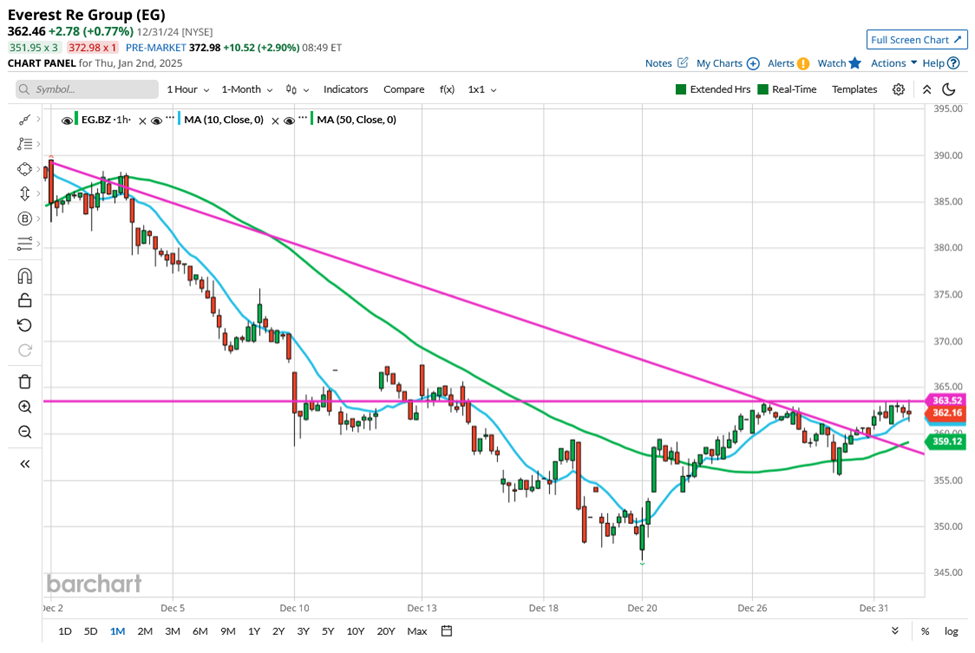
Source: Barchart.com
That’s the sort of earnings growth that's usually found in a high flying tech stock, not a staid financial, so it raises a question mark.
However, the purpose of this exercise was to highlight potential trade setups.
And in that spirit, if we draw a one month, hourly chart of EG, like the one above. We find an interesting situation, with the price bouncing off of a low of $355.46, and testing back to resistance at $363.52.
A break above which, could take us to $367.63 and perhaps $370.80.
Looking back to late November, Everest Re was trading as high as $392.78, and in early October it printed above $407.00.
Another Filter
Adding an additional filter of 1-year earnings growth (in this case I screened for growth of +15.00% or more, that's approximately 75.00% of the average 1 year EPS growth rate) trimmed the list to just 9 names.
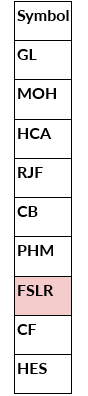
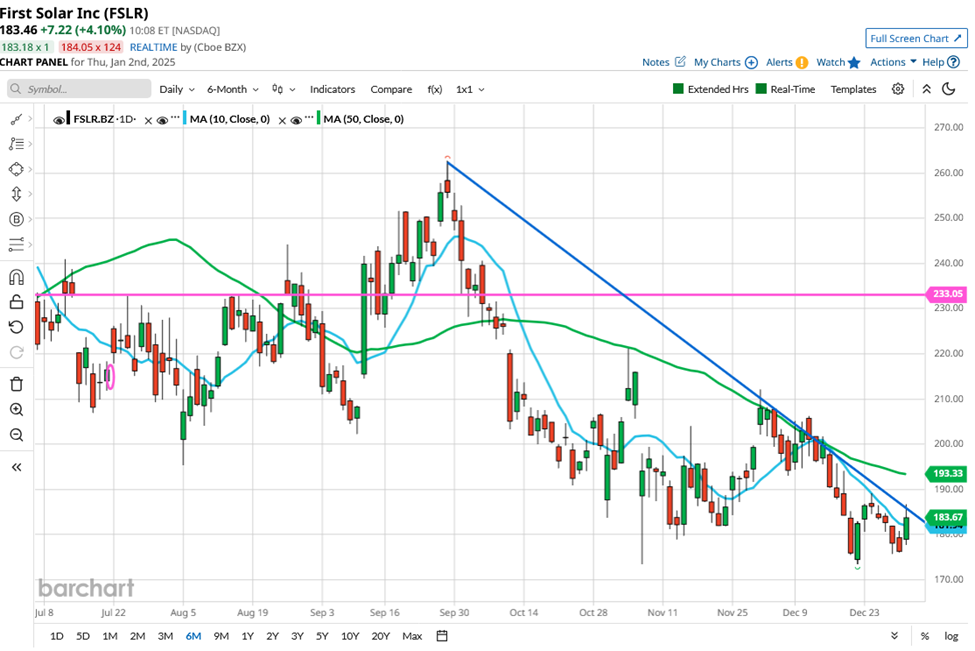
Among which is First Solar FSLR US.
Now it could just be coincidence or serendipity, but as I type they are trading up by +4.10%.
However, I am inclined to think its no coincidence and that other people in the market are on the lookout for opportunities and this one of those that they have alighted on.
Source: Barchart.com
And that's good, because if trade opportunities are to work then they need catalysts to set them in motion and momentum/wider interest, is just the thing, in what is essentially a mean reversion trade.
We have used three simple filters to identify a couple of trade setups. Of course, you can use more data and filters to dig deeper into an index, like the S&P 500.
However, as you may know I believe it's a good idea to keep complexity to a minimum in trading. Simplicity can be our friend when we are trying to shape the odds of success in our favour.
The information provided does not constitute investment research. The material has not been prepared in accordance with the legal requirements designed to promote the independence of investment research and as such is to be considered to be a marketing communication.
All information has been prepared by ActivTrades (“AT”). The information does not contain a record of AT’s prices, or an offer of or solicitation for a transaction in any financial instrument. No representation or warranty is given as to the accuracy or completeness of this information.
Any material provided does not have regard to the specific investment objective and financial situation of any person who may receive it. Past performance is not a reliable indicator of future performance. AT provides an execution-only service. Consequently, any person acting on the information provided does so at their own risk.