
I am starting this article with a series of charts.
charts that say a lot about the Energy sector right now.
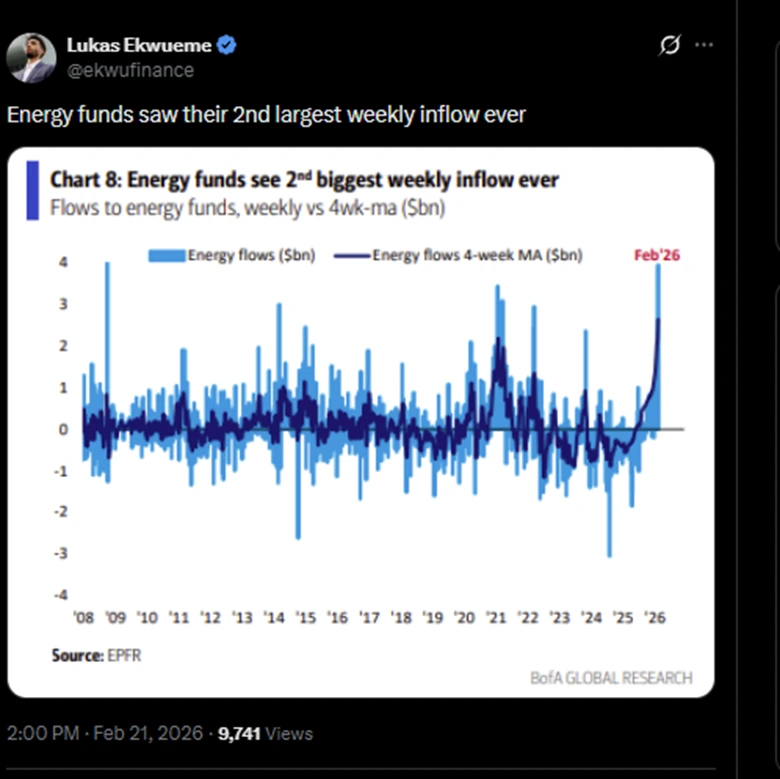
The first chart looks at the inflows, money moving into, Energy funds.
As you can see, the funds have enjoyed some of the largest inflows of new money they have ever seen.
Money managers, investors and traders all look to be putting their cash into the sector.
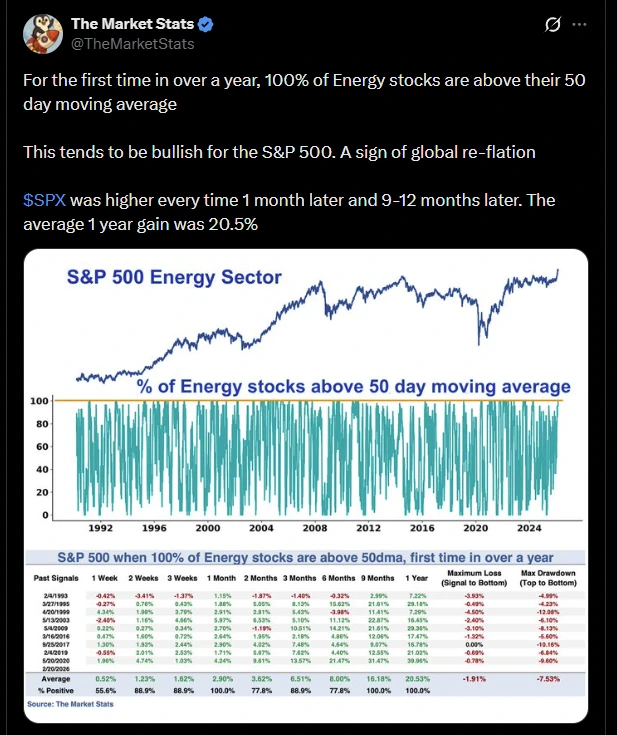
This inflow of funds is likely one of the reasons why 100.0% of the stocks, within the S&P 500 Energy Sector, are (at the time of writing) trading above their 50 D MA lines.
See the chart below.
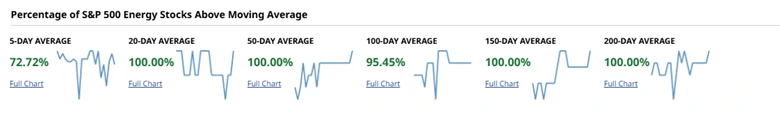
In fact it's not just in the 50 day timeframe that the bullish percentages in the energy sector are at, or towards, the top of their range.
Striking Oil
Of course Energy stocks have been on my radar (and hopefully yours too) for some time.
In fact, regular readers may recall that I wrote on the sector at the end of October (29/10/25), in a piece entitled
The Biggest Bang for Buck part II see here.
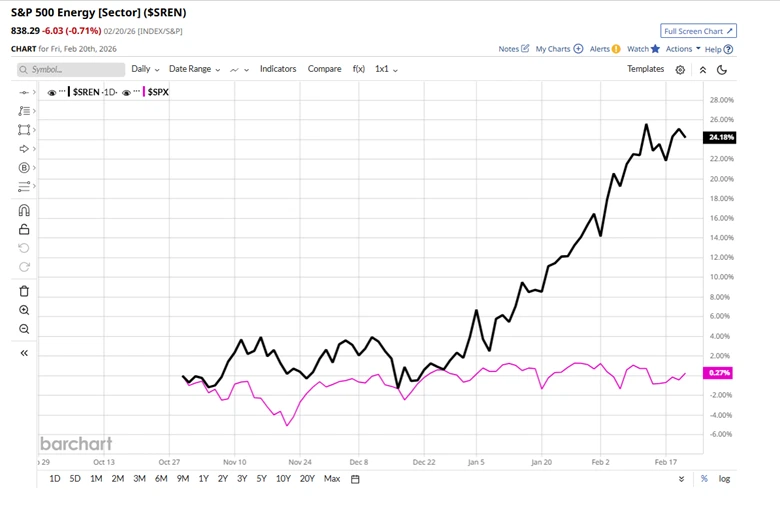
The article turned out to be prophetic, as the S&P 500 Energy sector added more than
+24.0%, since October 29th.
You can see this in black line on the chart below.
The pink line on the other hand is the performance of the S&P 500 index over the same period.
So in terms of delivering the biggest bang for your buck I think we can call that job done.
S&P 500 sectors performance over 6 months: Energy is comfortably on top.
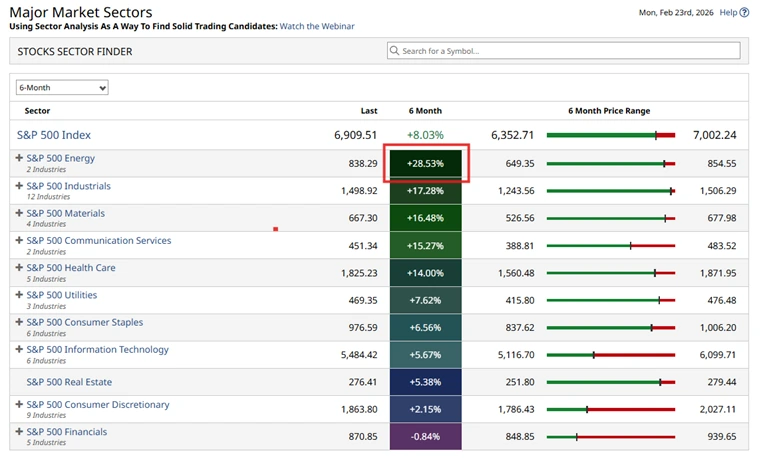
So having outperformed significantly in the prior period,can the Energy sector now act as a bellwether for the S&P 500?
Well the statistics suggest that it could.
For example, the Market Stats post above, highlights that, on prior occasions, when the 50 D MA % in the Energy sector has hit 100.0%. Then the S&P 500 index moved higher over the next month, and over over the next 9 to 12 months as well.
However, I think we need to caveat that somewhat.
I say that because these are extraordinary times in equity markets.
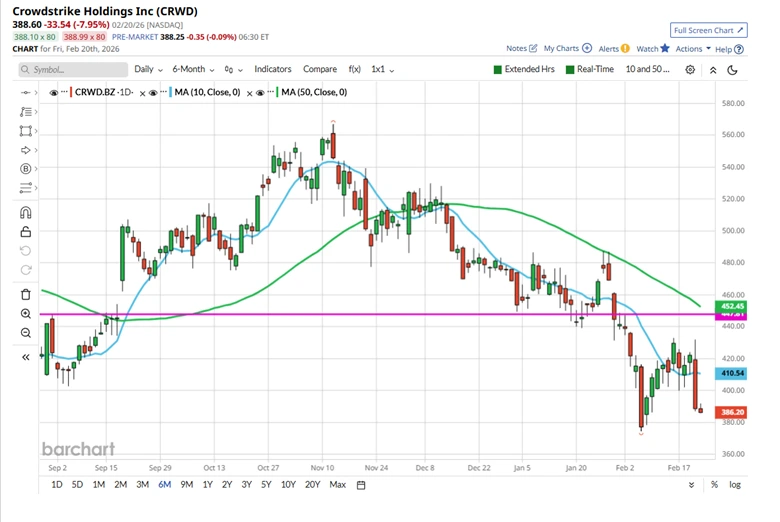
Traders remain skittish as far as software stocks are concerned.
Network security stocks were the latest to sell-off on AI fears as Anthropic launched a new tool called Claude Code Scrutiny .
Crowdstrike, CRWD US was a prime example, selling off by almost -8.0% in Friday's session (20/2/26).
I note they are due to report earnings on March 3rd.
Secondly, President Trump has re-ignited the trade wars by “lashing out” with the promise of new higher levies after the US Supreme Court struck down many of the tariffs he had introduced, via executive orders (rather than putting the policy through congress) just over a year ago.
And with events in the Middle East still unresolved and military action against Iran is a possibility. So there is every chance of more “chop” in the market near term.
I found another article I wrote which featured the Energy sector, this one published in January 2025 and entitled Trading success stories see here.
In this instance I looked at how fundamentals and technicals can be combined to identify high probability trading opportunities.
What this shows us is that we don't have to re-invent the wheel every time we trade.
Tried and trusted workflows and indicators can be used repeatedly.
The MA % indicators have been the source of numerous trading opportunities in the last few years.
Particularly around Energy stocks, which are sensitive to and respect changes in these indicators.
And it's highly likely that they will prove to be so again.
However, we need to be pragmatic. And with 4 out of 6 Energy sector MA % reading 100.00%, the upside opportunities in these stocks look limited. At least from this technical standpoint.
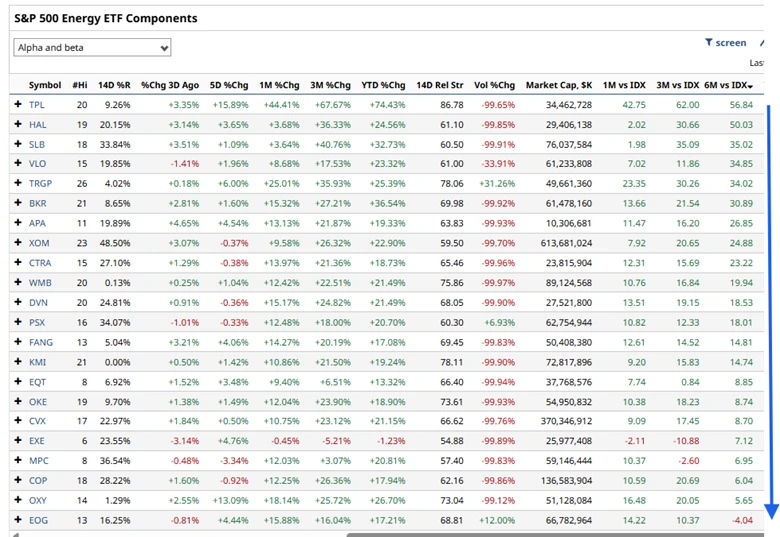
Table shows the S&P 500 Energy sector stocks ranked by their performance versus the S&P 500 index over 6 months- descending
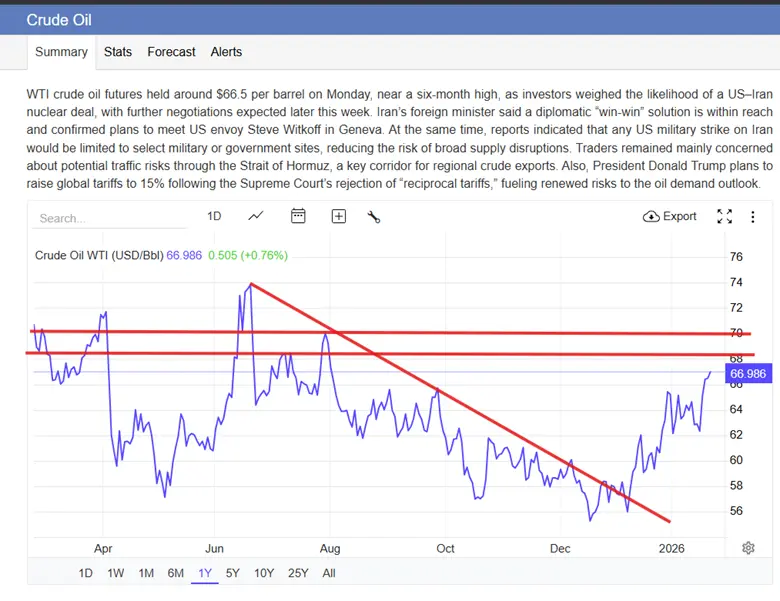
Ironically, crude oil prices were moving higher in Monday’s trade.
WTI made 4-week highs, and tested towards levels not seen for 6-months or more.
Suggesting that the supply and demand dynamics for oil might be the dominant factor around sentiment in the near term.
The information provided does not constitute investment research. The material has not been prepared in accordance with the legal requirements designed to promote the independence of investment research and as such is to be considered to be a marketing communication.
All information has been prepared by ActivTrades (“AT”). The information does not contain a record of AT’s prices, or an offer of or solicitation for a transaction in any financial instrument. No representation or warranty is given as to the accuracy or completeness of this information.
Any material provided does not have regard to the specific investment objective and financial situation of any person who may receive it. Past performance is not a reliable indicator of future performance. AT provides an execution-only service. Consequently, any person acting on the information provided does so at their own risk. Forecasts are not guarantees. Rates may change. Political risk is unpredictable. Central bank actions may vary. Platforms’ tools do not guarantee success.