In the first of these articles, we looked at how traders could try to identify the stocks that will outperform their peers under a common narrative, such as data centre and power demand, and the buzz around quantum computing.
The idea being that if you can find the “category killer”, then your trading gains could be greatly enhanced versus the rest of the pack, assuming that you execute and manage the trade effectively.
This time out, I want to continue in a similar vein and look at some other tools and indicators traders can use to highlight stocks that could give a bigger bang for your buck.
I want to run an experiment using the S&P 500 Energy Sector, which could be poised to move higher.
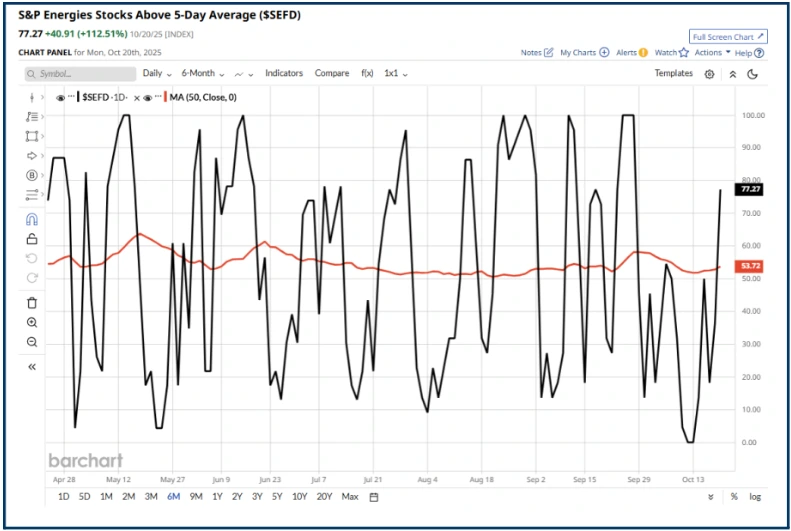
I say that because there has been a confluence of factors in the last few days, for example, the chart below shows the 5D MA% for the S&P 500 Energy sector, that is, the number of stocks trading above their 5-day moving average.
As you can see, this indicator rallied sharply on Monday, 20th October.
Source: Barchart.com
And not for the first time in recent days either, as you can see below.

Source: Barchart.com
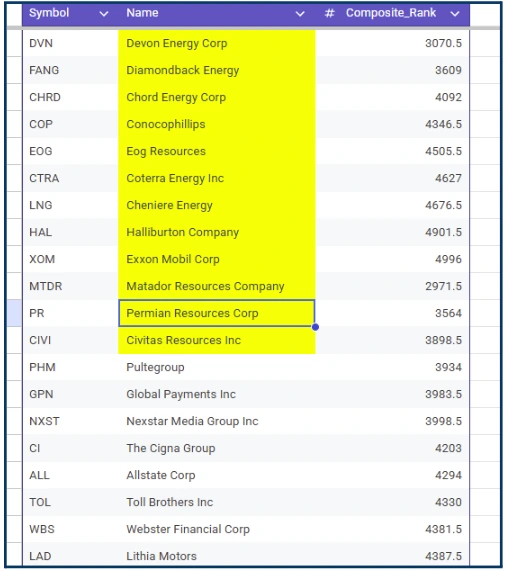
Coincidentally, I had run a screen of Russell 1000 stocks earlier in the week, looking to identify various groups or cohorts, for example, the 50 best stocks based on their fundamentals.
What stands out to me is the number of names from within the Energy sector that cropped up in this list, which I have highlighted below.
Russell 1000 stocks that look good on Fundamentals
Source: Darren Sinden
I also note the sharp rally in Natural Gas on Monday, 20th, which was up by more than +13.0% on the day.
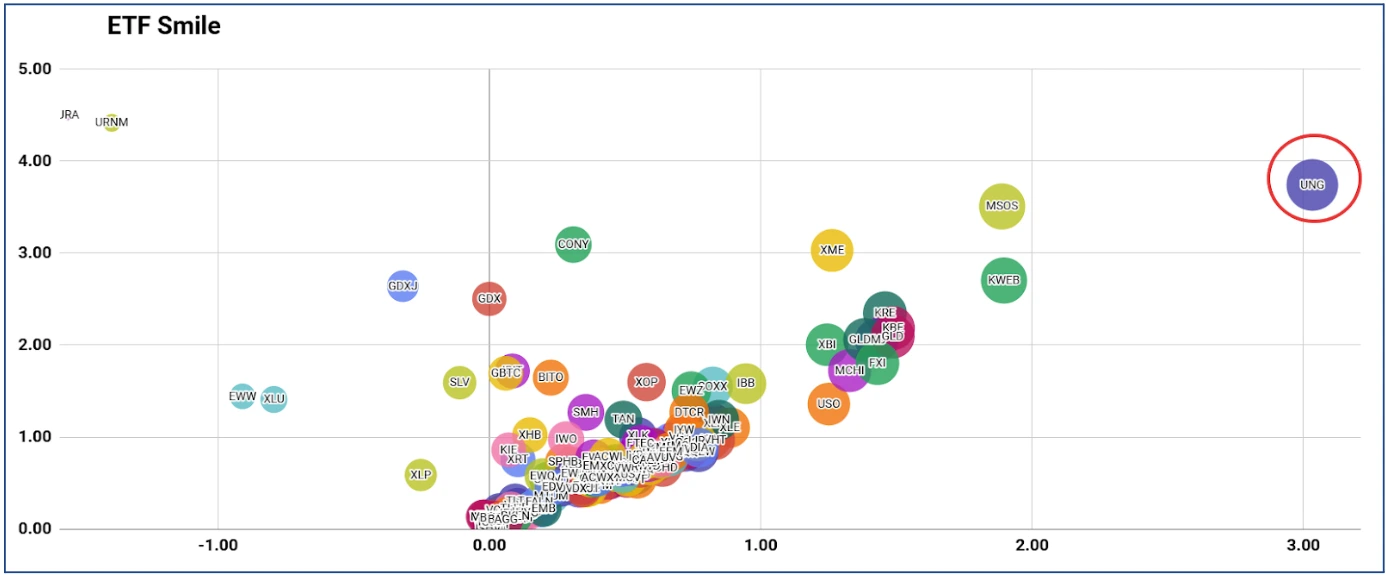
That strength was reflected in the showing of UNG, the US Natural Gas ETF, which was the best performer on the ETF Smile chart.
I have highlighted UNG below: remember that the higher up and further over to the right, the stronger the stock, or in this case, the ETF, looks on a relative basis.
USO, the US oil ETF, can also be seen on the right-hand side, above and to the right of figure 1 on the horizontal axis.
By contrast, URA and URNM, ETFs which track uranium-related stocks, were very weak, and could be found in the top left corner of the Smile.
Source: Darren Sinden
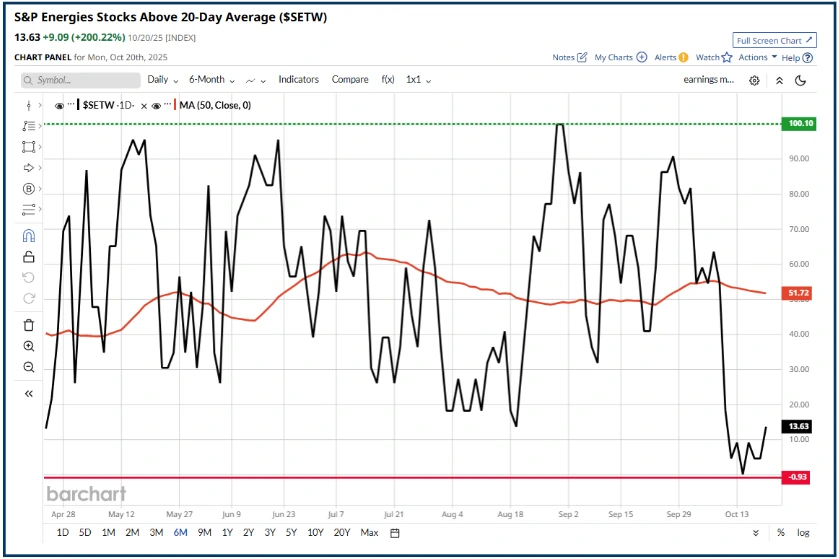
If we look at the 20D MA% for the S&P 500 Energy Sector. We find that it has also rallied; however, despite that, it remains well below not only the 5D MA % but also its longer-term peers as well, as you can see in the graphic below the chart.
Source: Barchart.com

Source: Barchart.com
That divergence makes me think that there could be further gains to come in the indicator, and thus the sector.
When I talk about looking for “ripples on the pond”, this is the sort of thing I am searching for.
So with that in mind, if the Energy sector and the stocks within it do enjoy a rally, which stocks might perform the best?
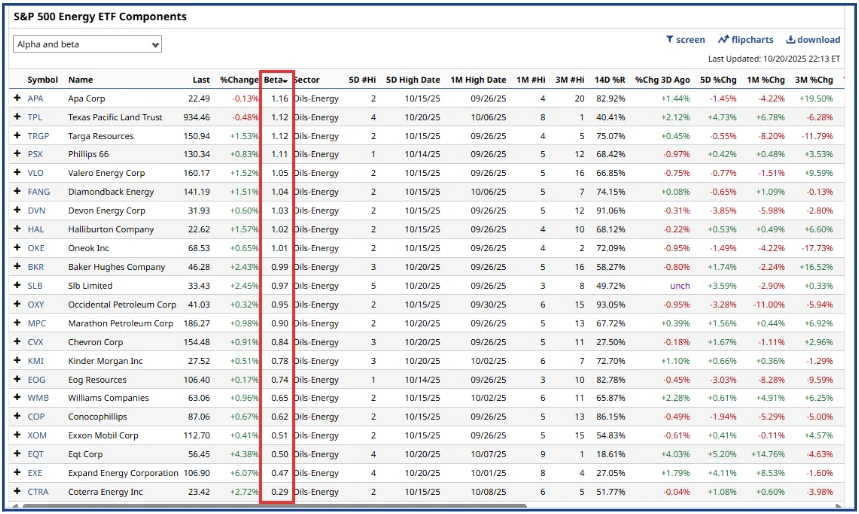
Source: Barchart.com
One way we can try and answer that question is to look at the characteristics of stocks in the sector, one of which is their Beta.
Beta is essentially a measure of sensitivity; the higher the stock's beta then the larger the move it's expected to make in reaction to a given move in the sector or index that it’s a component of.
Simply put, the prices of stocks with higher Betas should move more than those with a lower Beta.
The table above is ranked by Beta, but it also contains some other key metrics such as 3-month % Chg, which is a good proxy for momentum imho.
APA Corp APA, has the highest Beta among S&P 500 Energy sector stocks. However, it is also the top performer over 3 months, up by +19.50%
Refiner Valero VLO also has a high Beta, and a better-than-average performance than its peers over the last 3-months.
Oil services business Haliburton HAL is another that scores highly on Beta, and that’s positive over 3-months.
Coincidentally or otherwise, Haliburton announced a collaboration with Volta Grid on Tuesday (11th October), and the stock was up by more than +4.0% in the premarket.
The average 3-month performance in the Energy sector is just +0.27%.
That figure provides us with another benchmark, against which to measure/rank stocks from the same sector or index against.
It,s not certain that there will be a bigger bounce in the Energy sector, although Crude Oil is up +1.20% as I write, However, if we do see a recovery, it will be a good test case for the idea that high Beta and an a performance that’s well away from the sector average, are tools we can use to find stocks that have the biggest bang for your buck.
The information provided does not constitute investment research. The material has not been prepared in accordance with the legal requirements designed to promote the independence of investment research and as such is to be considered to be a marketing communication.
All information has been prepared by ActivTrades (“AT”). The information does not contain a record of AT’s prices, or an offer of or solicitation for a transaction in any financial instrument. No representation or warranty is given as to the accuracy or completeness of this information.
Any material provided does not have regard to the specific investment objective and financial situation of any person who may receive it. Past performance is not a reliable indicator of future performance. AT provides an execution-only service. Consequently, any person acting on the information provided does so at their own risk. Forecasts are not guarantees. Rates may change. Political risk is unpredictable. Central bank actions may vary. Platforms’ tools do not guarantee success.