
I have to confess that I have been scratching around for the first few days of this month.
I just don't have a handle on the market right now, any innate sense of what comes next, or where we are headed.
No one is more surprised about that than I am.
It’s not that I should always know what’s coming next and what to do with that knowledge. After all, I am just as fallible as anyone else.
Rather, it’s the fact that it seems to have happened almost overnight.
I came back from holiday a few weeks ago and got into the stride of things pretty quickly. And if I say so myself I made some good calls, some of which I shared in my previous articles.
What’s made it more frustrating is that the market has been range-bound too.
Effectively moving sideways and we have gone from a period of heightened volatility to almost none at all.
As this chart of the VIX index testifies.

Source: Barchart.com
And it’s not just equity markets that have seen volatility fall away after a spike hike higher. The same is true of the US Treasury bond market as well, as this chart of the Move index shows.

Source: Barchart.com
Let’s dig a bit deeper in to that trend
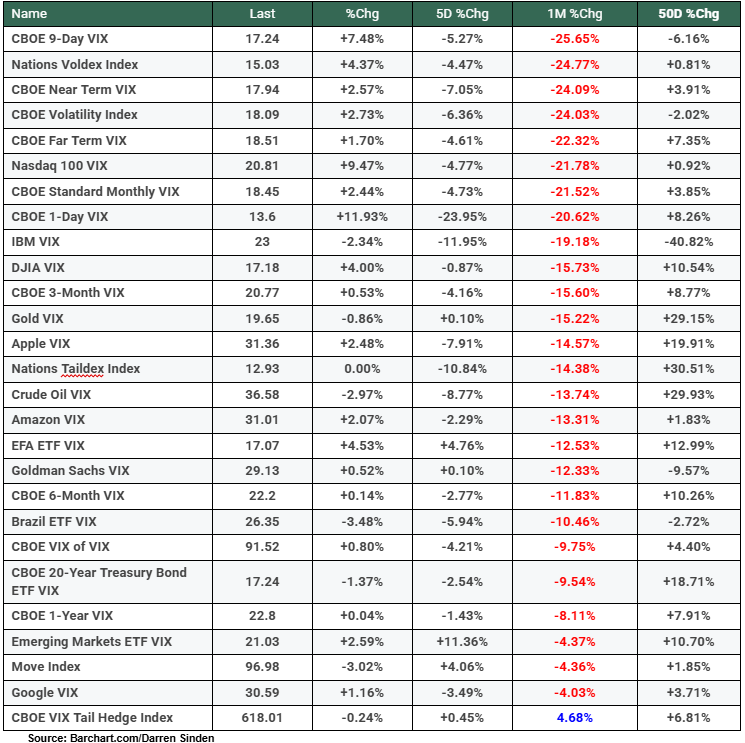
This table shows us the performance of a selection of volatility indices ranked by 1-month % change, descending ,and all but one of them have lost ground since early May.
Volatility indices ranked by 1-month % change
And having seen this data I don't feel quite as much of a spare part as I did.
And I feel better still having seen this next chart which shows the CBOE S&P 500 Dispersion index.
This index effectively tracks the likelihood of differing returns from the stocks within the S&P 500.
The higher the dispersion index is, then the higher the likelihood is that these stocks will move independently and produce differing returns.
The lower the index is, then the higher the chance that the S&P 500 stocks will move in a similar fashion and behave less like individuals.

Source: Google Finance
The net effect of that is that there is less to catch my eye, fewer market moves and set ups to get my attention when I am looking for opportunities.
However, I can't just sit around twiddling my thumbs. Of course, sometimes the most sensible, but also the hardest thing to do, in the markets is to do nothing.
But I don't think this is one of those times.
I am not advocating trading for trading's sake, instead, I have been doing some research, but in this instance, I have left my models alone. Not least because I am testing some new signals and indicators. right now. Though I am not sure if I trust the data and what they are telling me.
Instead, I have been reading. Reading a mixture of articles, news stories and broker research notes, and that’s also helping me to get my mojo back. You can find quite a lot of this type of material on LinkedIn these days.
I have come across some very interesting ideas and stories, and looked back at ideas that I wrote about last year (which have come to fruition recently) for inspiration.
One of the charts I came across when I was doing my research was this one from Goldman Sachs, published in mid-May, which compares 12-month forward PEs for a range of markets with their historical range and some statistical measures.

Source: Goldman Sachs research /LinkedIn
The Orange diamonds are the current valuation, and what stands out immediately is how much the US is running ahead of its peers.
We can also see that the US has also dragged up the PE of the AC or all cap world index to just over 18.0 times, because, when it’s stripped out, the AC world ex US PE ratio falls to 13.90.
Europe, which has had a good run in 2025, still only trades at 14.40 times and the UK at just 12.40.
Only a fraction above the Emerging Markets, which in itself is food for thought.
Is the US dear? Or is the rest of the world looking cheap? I think it's possible for both of those viewpoints to be right at the same time.
However, when a market is trading above its long-term averages, it gets ever easier for it to disappoint its audience.
The US is trading at 1.75 times the multiple of the UK.
To me, that says that UK companies must look cheap to US corporates, fund managers and private equity firms, and that could well mean more bids for UK-listed names from the other side of the Atlantic. Particularly if sterling were to reverse more of its +8.17% year-to-date gains against the US dollar.
GBP USD

Source: Trading Economics