
On any given day, there are thousands of opportunities to trade. The trick for traders, however, is in sorting the wheat from the chaff, that is, filtering the trade opportunities that have a higher probability of success from those that are no better than a coin toss or worse.
Looking at the chart and or fundamentals for every instrument, every day is clearly a non-starter, but what if you only looked at stocks which were doing something that was out of the ordinary, something that made them stand out from the crowd?
The good news is that you can find these kinds of stocks using some simple hacks and taking some time to study their data.
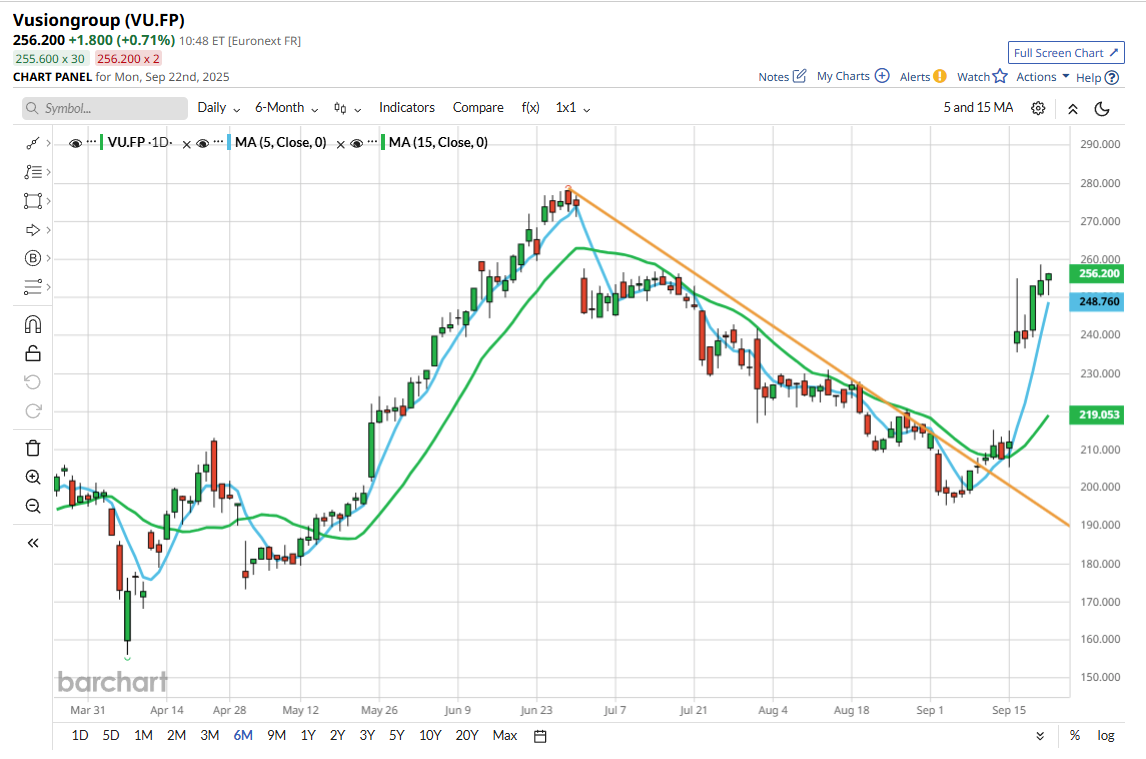
Here is an example of that process in action: VusionGroup VU FP is a French company that specialises in digitisation for bricks-and-mortar retailers.
I came across it recently in a list of stocks that had posted an MA crossover, specifically where the 5-day MA line had crossed above the slower-moving 15-day line.
Using the 5 and 15-day lines, we get to see and contrast the price momentum in a stock over both one and three trading weeks.
When the 5-day line crosses the 15-day line, that tells us that there is shorter-term price momentum; the direction in which the cross takes place is the direction that the price momentum is moving. In the case of VusionGroup, that was upward.
Before the MA cross, the stock had also moved above a downtrend line that had been in place since early July. A quick internet search revealed that VusionGroup would report its H1 earnings after the close on 15/09/2025.
An event that could act as the catalyst for a bigger price change.
 Source:Barchart.com
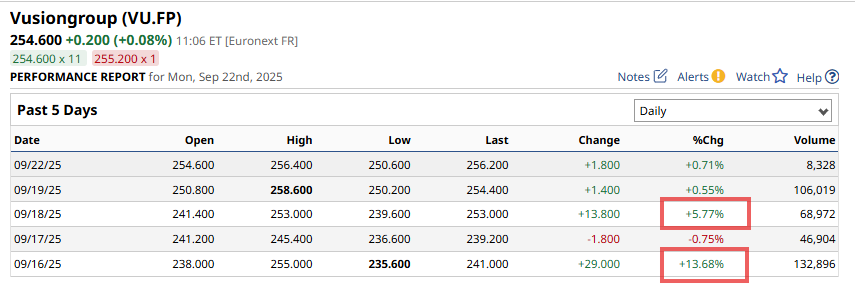
Which is exactly what happened.
As you can see in the table below, the stock jumped up by +13.68% on16/09/2025 and added another 5.77% on the 18th, creating a +20.0% weekly gain.
 Source:Barchart.com
You can screen for actions like MA crossovers using platforms like Barchart.com or TradingView.
The screen results can often be saved and downloaded, or exported to Excel or Google Sheets, where they can be sorted, filtered, or even perhaps enriched with other data.
Spotting the change
Another useful skill to have is the ability to spot changes in the price action or behaviour of a stock or sector, not least because that’s the kind of thing that could signal a trend change in every sense.
I first commented on the GX Uranium ETF ticker URA back on 03/09/2025, highlighting that it had an interesting chart. However, it wasn't until almost a week later that it really caught my eye on the ETF Smile chart.
On 09/09/2025, URA started the day on the LHS of the ETF Smile ( see below). Positioning, which suggested relative weakness in the price action.
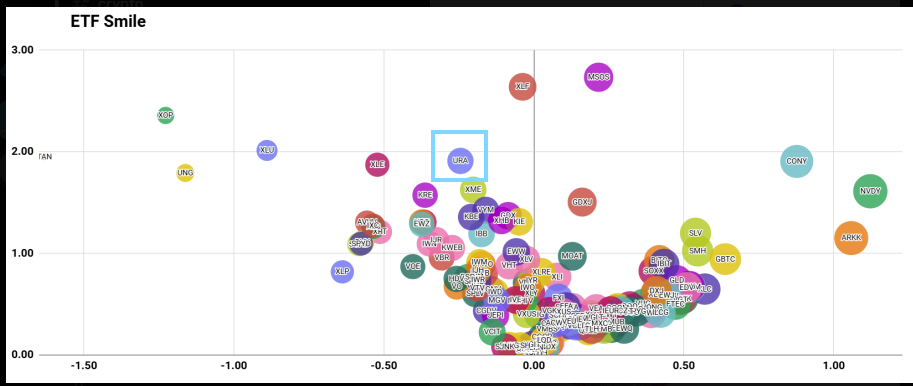
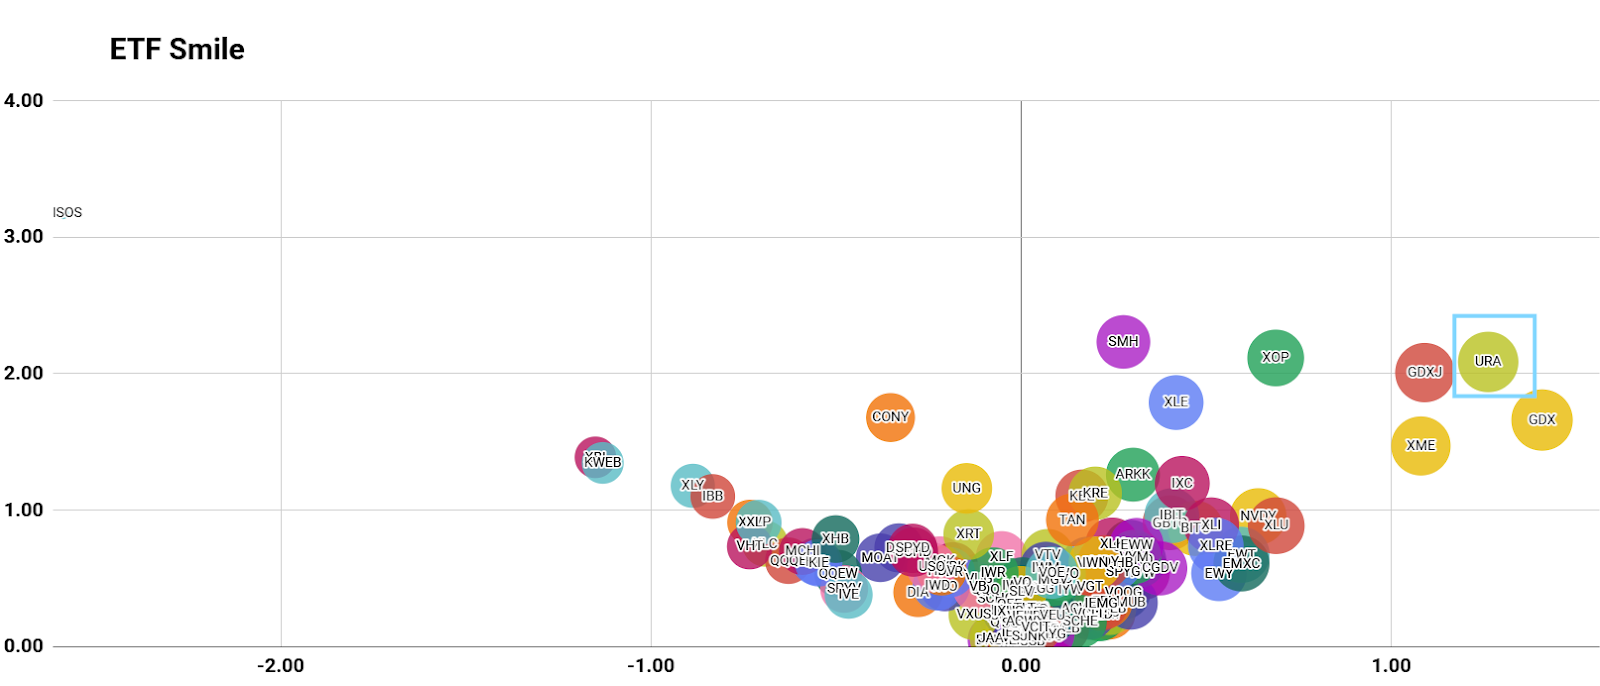
However, just 90 minutes later, we had a completely different picture in front of us. (See the second bubble chart below.)
Because URA had moved to the far right of the Smile to a position that indicated relative strength.
The fact that it had transitioned from weakness to strength in a short space of time was a very positive indicator.
Source: DarrenSinden
That strength continued, and URA was often found on the right-hand side of the ETF smile, in the coming days, including on Friday, 19th, when the stock added +8.11% on th session, its second significant price gain in a week.
The ETF Smile on the close 19-09-2025
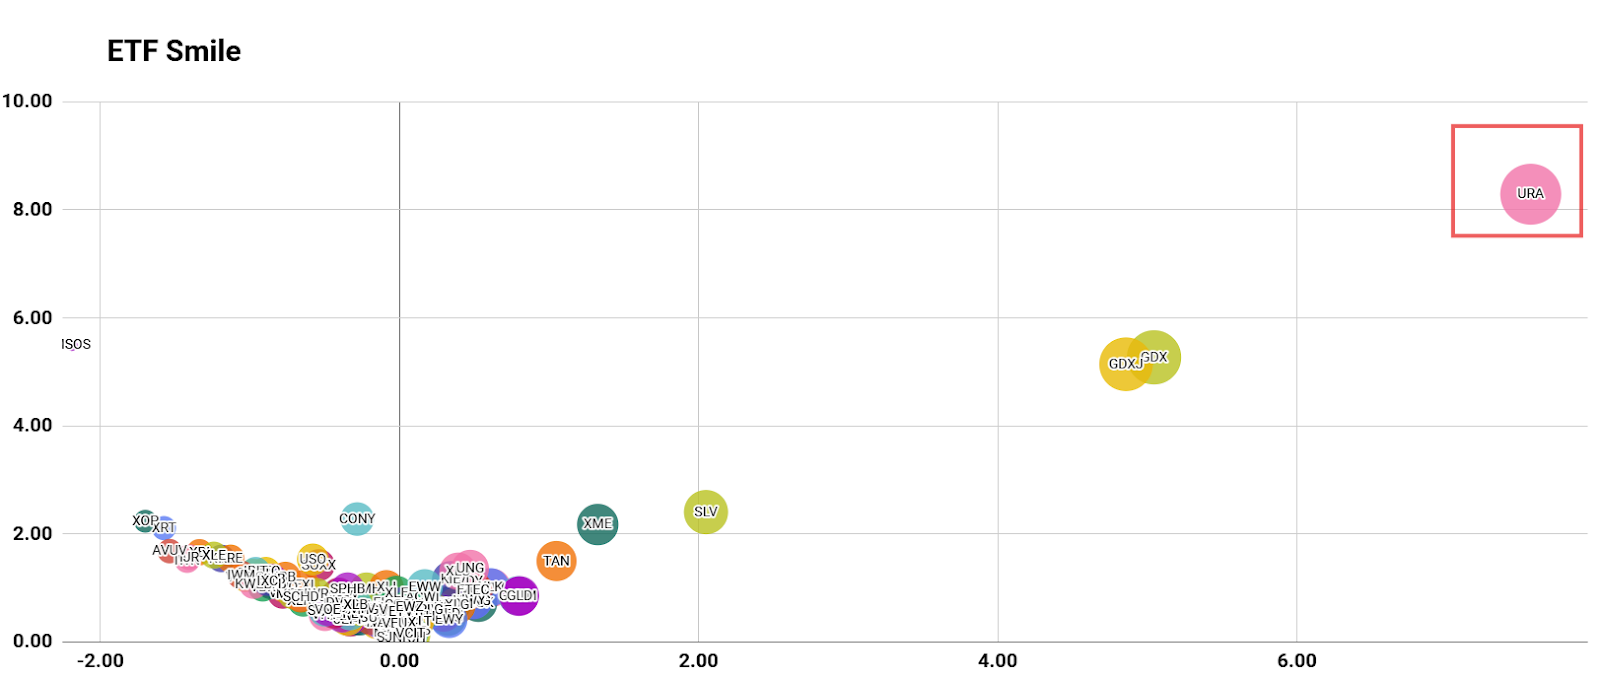
Source: DarrenSinden
URA ETF High, Low, Open and Close data
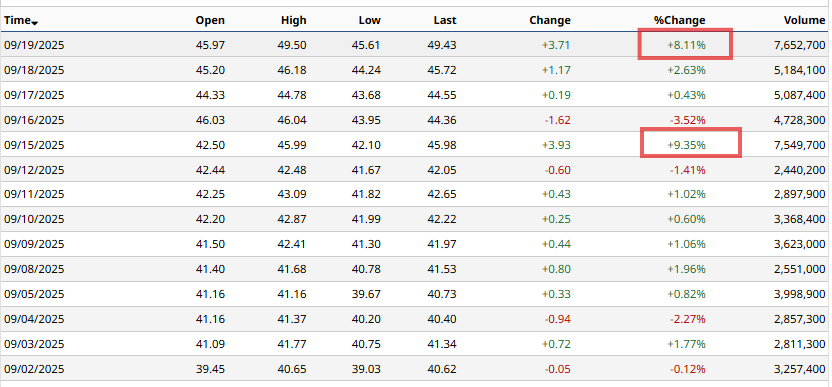 Source:Barchart.com
Even if you couldn’t trade URA itself ( not all ETFs are available to retail clients in certain jurisdictions) , the ETF acts as a proxy or barometer for the Nuclear story as a whole.
This is a hot property right now, because of the role that nuclear power may play in providing energy for data centres, a theme that I have highlighted regularly in my articles.
One of the poster boys of that story is NuScale Power SMR US, which rose by more than +22.0% in Friday's sessions.
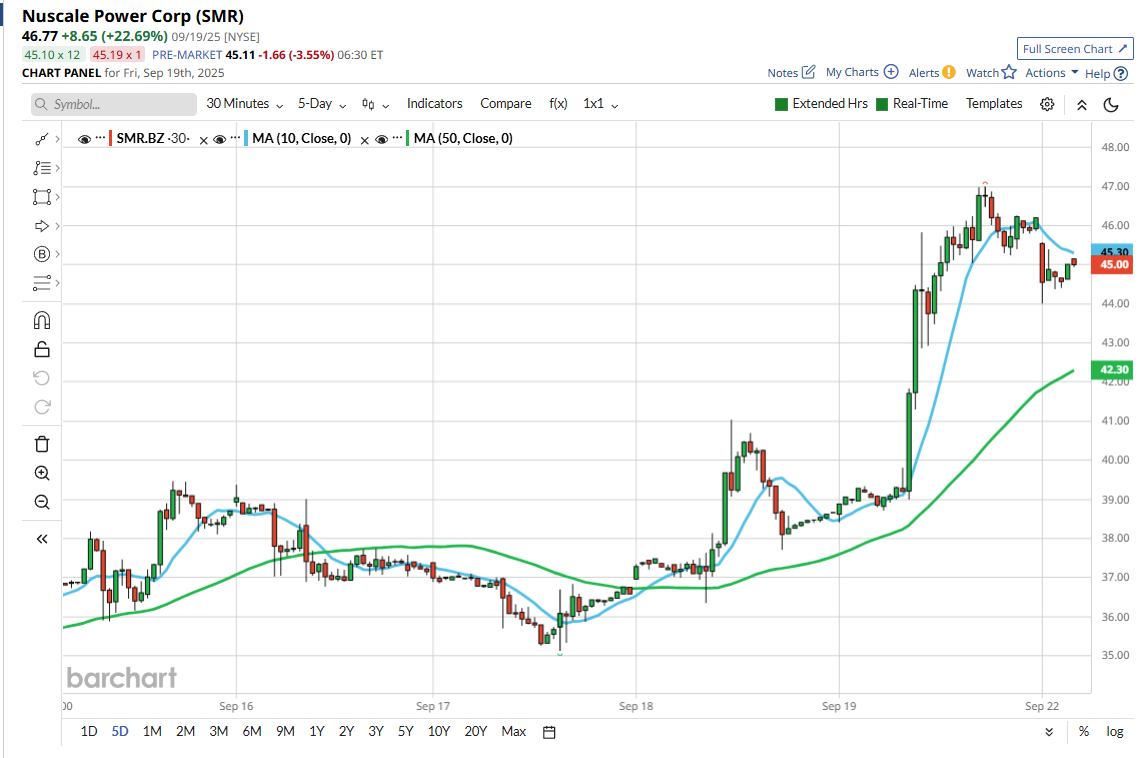 Source:Barchart.com
Lateral thinking is also a skill that traders would do well to develop because it can allow you to get exposure to a theme or narrative, even if you can't trade it directly. Finding adjacent proxies can be very lucrative as long as you pick the right one, of course.
The information provided does not constitute investment research. The material has not been prepared in accordance with the legal requirements designed to promote the independence of investment research and as such is to be considered to be a marketing communication.
All information has been prepared by ActivTrades (“AT”). The information does not contain a record of AT’s prices, or an offer of or solicitation for a transaction in any financial instrument. No representation or warranty is given as to the accuracy or completeness of this information.
Any material provided does not have regard to the specific investment objective and financial situation of any person who may receive it. Past performance is not a reliable indicator of future performance. AT provides an execution-only service. Consequently, any person acting on the information provided does so at their own risk. Forecasts are not guarantees. Rates may change. Political risk is unpredictable. Central bank actions may vary. Platforms’ tools do not guarantee success.