
These are interesting times for equity markets and traders.
In the last week we have seen the Federal Reserve cut interest rates by 50 basis points and have also seen the Chinese authorities launch a stimulus package, designed to re-invigorate the flagging economy in the world's second most populous country.
In this respect the market has got what it wished for.
However, now that the presents have been unwrapped, what is there for traders to look forward to? And where do the opportunities lay from here?
The US election
Of course we can’t ignore the upcoming US elections on November 5th, and the possibility that policies touted by the candidates on the campaign trail will make it into law.
Points of concern for the markets here would be a tax on unrealised capital gains, under Kamala Harris, and the prospects of further tariffs and trade wars under Donald Trump.
Putting the election to one side for the moment, where might we look for opportunities?
Well, what about starting with these charts on regional equity valuations from JP Morgan Asset Management.
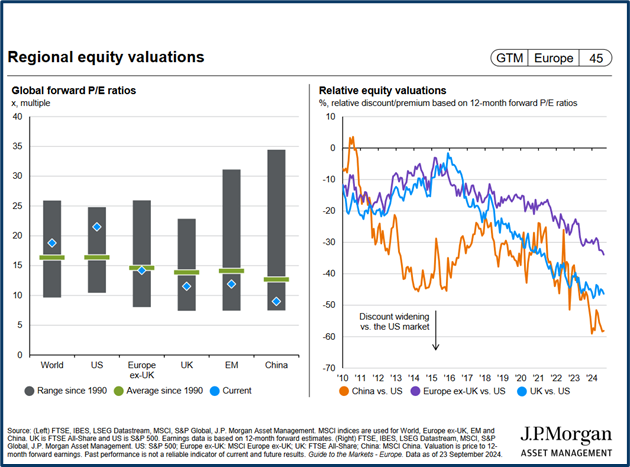
Source: JPM AM
Is China waking up?
As we can see the PE ratio in Chinese equities is at the bottom of its range since 1990, and below the average over that 34 year period.
The stimulus package announced in Beijing this week was criticised for being too small to make any major, or lasting changes, to the underlying economy.
And it may be that China will need to use a bigger package of measures, to kick start the world's second largest economy. Which has been “sleep-walking” post the pandemic. But if it does that, then we may see a bigger bounce.
Not that Chinese equities were immune to the recent stimulus measures
KWEB, the China internet ETF, rallied by more than +10.0% on Tuesday and by more than +16.0% over the last week. Tencent Music which trades in the US under the ticker TME was up by +16.40% and JD.com Ticker JD, rallied by +13.90% on Tuesday, and there were many more examples too.
However as I write on Wednesday afternoon, those same shares are already shedding a portion of their gains.
US equities
In terms of domestic US equities we were reminded about the importance of power/ electricity recently, something I touched on back in July in the article Different paths to the same destination.
The share price of Constellation Energy CEG US jumped by +22.0% when it announced it had signed a deal with Microsoft to provide power for its data centres.
That power will be generated by a previously mothballed nuclear power plant, on Pennsylvania's Three Mile Island.
That news suggested that Nuclear energy could undergo a renaissance all of its own.
Uranium miner Cameco Corp CCJ US jumped by +16.05% in the last week as a result.
It's interesting to note that there was a bullish momentum signal on the Cameco one-month chart, the day before the Constellation Energy news. As the faster moving 10 hour moving average crossed up through the slower moving 50 hour line.
I have highlighted the MA crossover below.
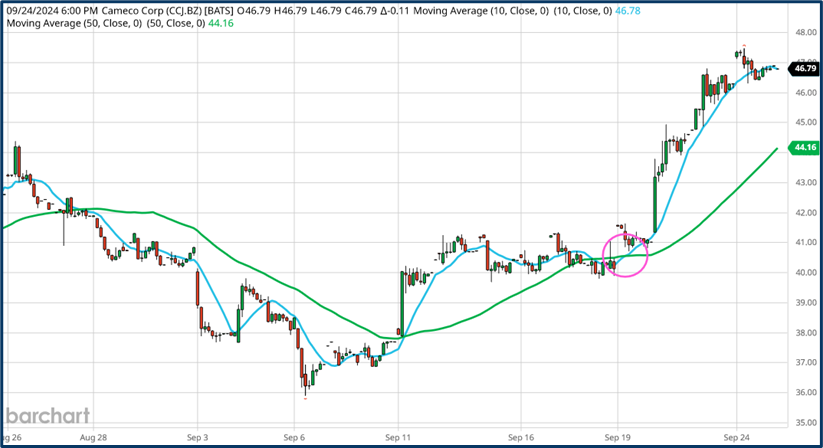
Source: Barchart.com
It is also interesting to note that generator Vistra Energy VST US, one of Constellation Energy’s sector peers, is now the biggest gainer in the S&P 500 year to date, eclipsing Nvidia in the process.
VST has rallied by +191.80% during 2024 to date.
However those gains could be part of a last hurrah from US equities.
Why do I say that?
Well take a look at these charts,(which once again are from JPM AM), the charts show that high, future return,s in the S&P 500, are much thinner on the ground, or could even turn negative, when PE ratios in the index, are at or above their current levels.
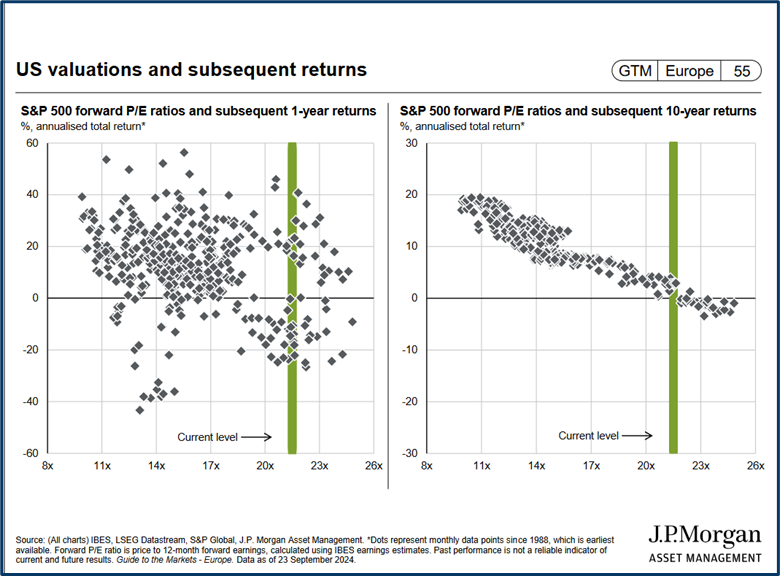
Source: JPM AM
European value?
But if US markets are looking expensive then at a sector and index level, many of their European counterparts are looking relatively cheap.
The green diamonds in the right hand chart below show the current valuation of European sectors compared to the US, and relative to their average valuation, which is shown by the grey bars.
The further to the left the diamonds are, then the “cheaper” the sector or index is on a forward PE basis, relative to their US peers.
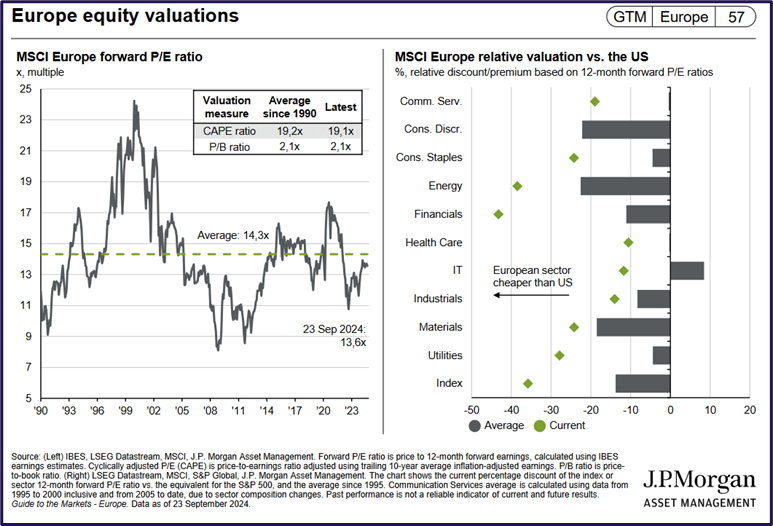
Source: JPM AM
Expensive? Maybe? But not necessarily overbought
Let’s not forget this recent chart from Bank of America’s quant strategy team either, which showed that S&P 500 looks expensive in 19 out 20 long term valuation metrics the team monitors.
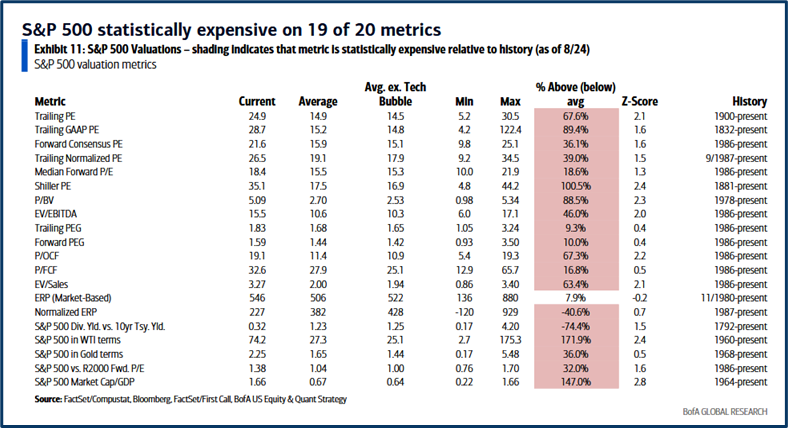
Source: Bank Of America
Of course that isn't to say that US equities and the S&P 500 can't run higher because they can,
Mot least because we may genuinely be on the cusp of a new industrial revolution.
One that's driven by AI.
It's possible that after several years of hype we are about to enter an era where AI starts to make businesses more efficient and data centric, providing managers with insights and ideas that had not previously been seen or considered.
The boom in data centre construction and the ever increasing demand for electricity to power them is already sending ripples throughout the market and this may be just the beginning.
The information provided does not constitute investment research. The material has not been prepared in accordance with the legal requirements designed to promote the independence of investment research and as such is to be considered to be a marketing communication.
All information has been prepared by ActivTrades (“AT”). The information does not contain a record of AT’s prices, or an offer of or solicitation for a transaction in any financial instrument. No representation or warranty is given as to the accuracy or completeness of this information.
Any material provided does not have regard to the specific investment objective and financial situation of any person who may receive it. Past performance is not a reliable indicator of future performance. AT provides an execution-only service. Consequently, any person acting on the information provided does so at their own risk.