
One of the best things about being an independent market commentator is that I can look at a wide range of markets and topics.
I have what’s been described as an inquiring mind so I am well suited to the role, which is just as well.
Sometimes I find that I am exploring two seemingly different topics, which ultimately converge, and that's when things can get very interesting.
Narratives at work
AI is the dominant theme in the markets at the moment but attention is also turning to areas of the market that will benefit from its continued growth.
One area that looks likely to benefit, both now and in the future, is energy and power. I tapped into this back in April, in the article The Importance of Defensive Stocks and Sectors
The S&P 500 Utilities sector which includes the electric power industry rallied by some +15.0% between April 17th and May 16th on expectations about increasing demand for power from AI, and the data centres behind the chatbots.
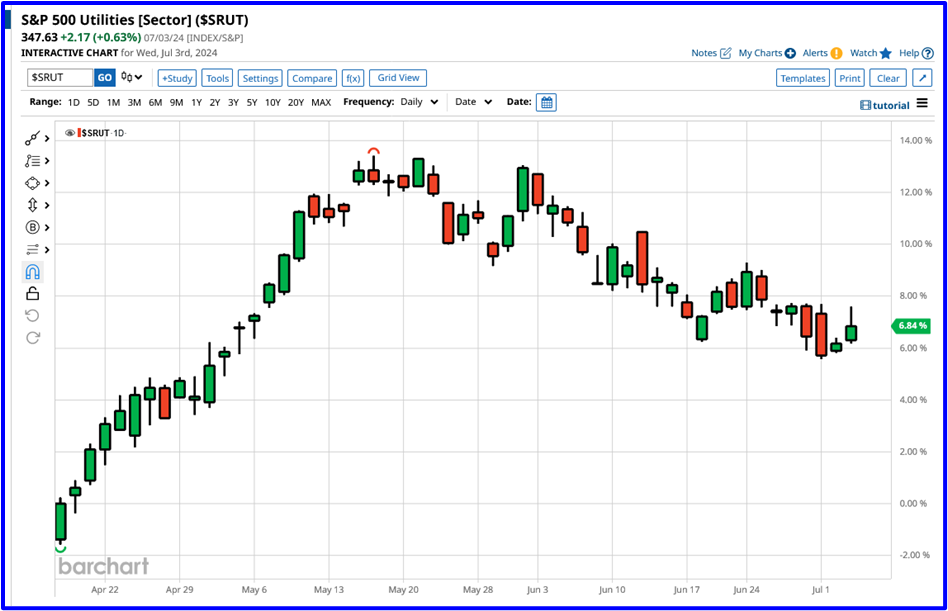
Source: Barchart.com
Top-Down
That was at least a couple of months ago and the market's thirst for all things power has cooled off somewhat, but it hasn't gone away.
Consider these charts from Deutsche Bank on demand for renewable energy among the mega-cap tech companies.
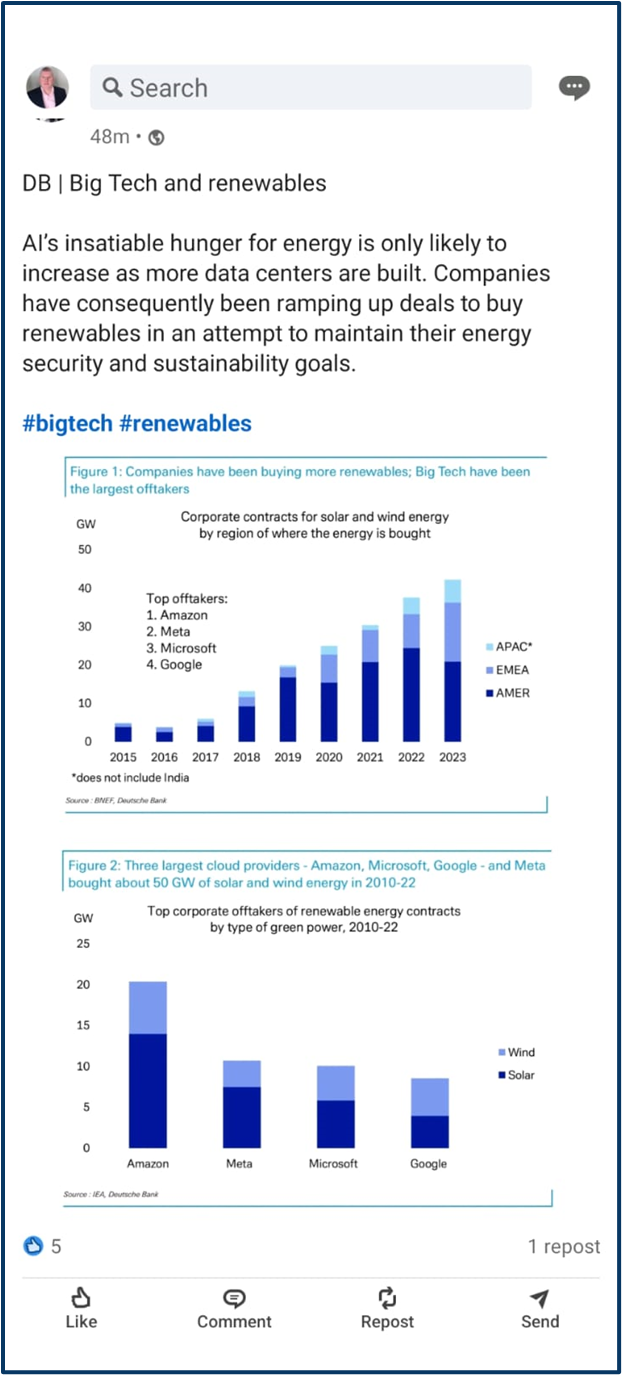
Source: Deutsche Bank
Amazon, Meta, Microsoft and Google (Alphabet) have become major buyers of renewable and green energy.
That’s not so surprising when we consider that, according to commercial property experts CBRE,
Data Centre capacity in North America and Europe expanded by +20.0% or more, in Q1 2024 alone
Nor is that growth confined to the developed economies of the West.
Just look at this chart from HSBC, which shows the total power-generating capacity in Malaysia, versus the demand for power, from new data centres in the country.
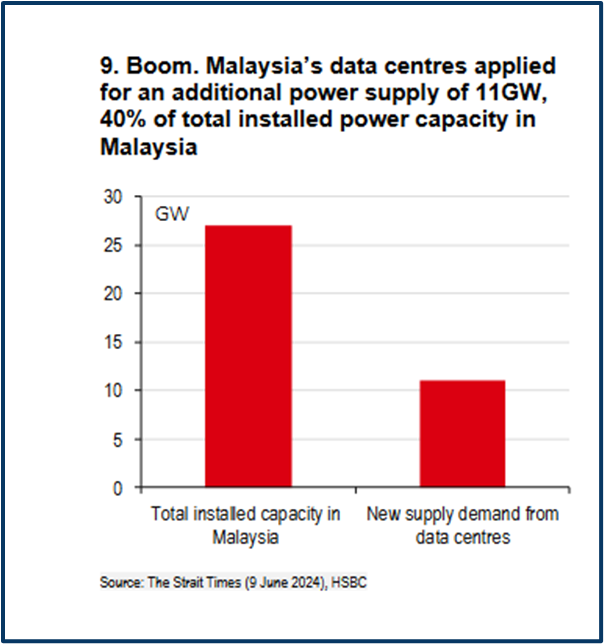
Source: HSBC
The increased demand is quite frightening, taking up more than a third of the country’s available power supplies.
Bottom-Up
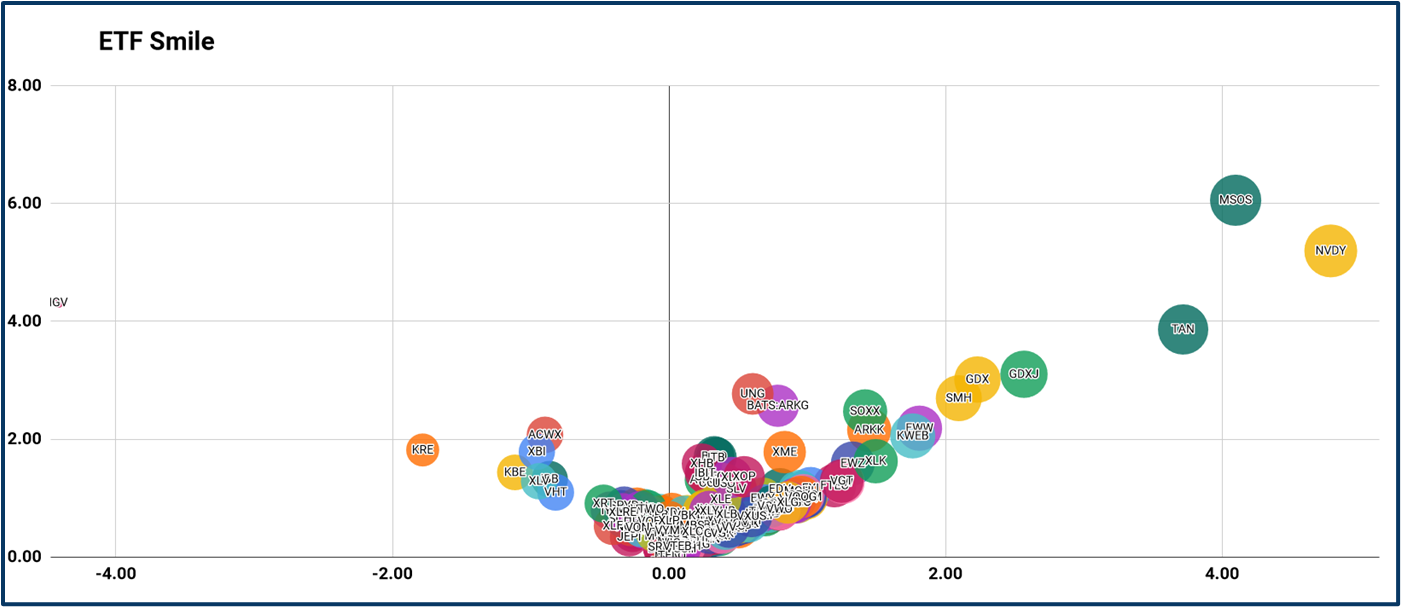
Now let's consider something bottom-up rather than top-down, which came to light in this chart of popular US ETF performance.
The Smile chart, of which this one, is my own invention. And they are designed to highlight relative strength or weakness in a stock's price action, compared to its peers.
The name Smile comes from the pattern or distribution we see with the strongest performers moving high and to the right, and those with the weakest price action, moving to the top left-hand side of the chart.
One of three ETFs in the top right of this screenshot (taken on the close ahead of July 4th), is TAN US, the Invesco Solar ETF, which holds a portfolio of solar energy and technology stocks.
TAN had appeared on the right-hand side of the ETF smile on several occasions of late suggesting to me that there was interest in the fund and that the price could pick up.
Source: Darren Sinden
Key holdings
One of the biggest holdings in the ETF is First Solar FSLR US I stock I have followed for much of 2024 to date.
Interestingly the prices of TAN and FSLR haven't tracked each other that closely, over the longer term. However, more recently they have seemed to be moving in lockstep.
With TAN looking like it was in demand, it seemed logical to me that there was an opportunity in First Solar and indeed there was, with the stock adding more than +6.60% in a shortened session ahead of the US Independence Day holiday.
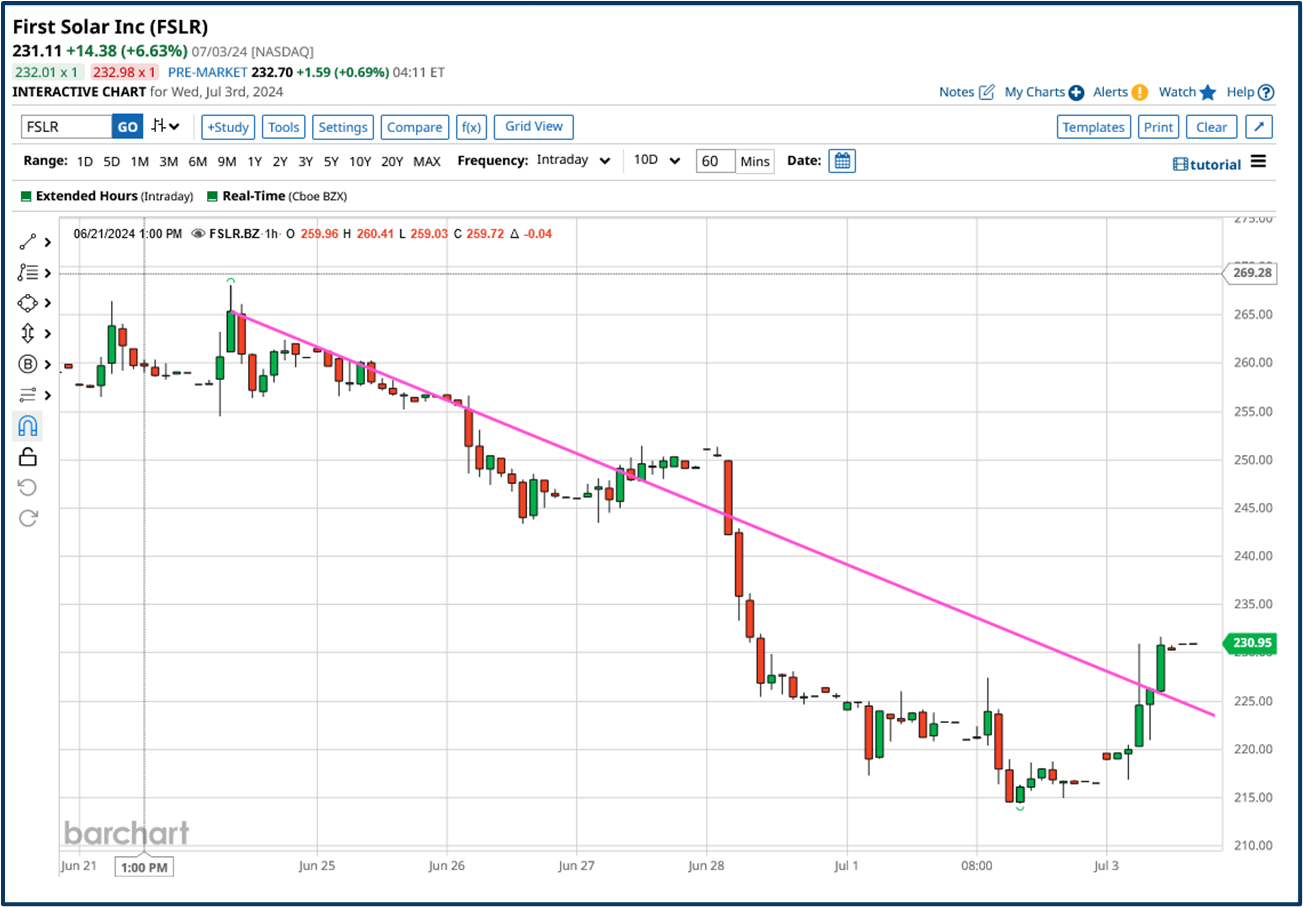
Source: Barchart.com
Thinking like a trader
Being aware of and keeping up to date with narratives that are driving the markets is a good discipline to have as a trader.
As is being able to think about which instruments those themes could affect, and recognising that the relationships between those instruments, such as ETFs and the stocks within them, are two-way streets. Such that the price moves in one can create trading opportunities in the other and vice versa.
If you find yourself in this kind of headspace then you are thinking like a trader.
The information provided does not constitute investment research. The material has not been prepared in accordance with the legal requirements designed to promote the independence of investment research and as such is to be considered to be a marketing communication.
All information has been prepared by ActivTrades (“AT”). The information does not contain a record of AT’s prices, or an offer of or solicitation for a transaction in any financial instrument. No representation or warranty is given as to the accuracy or completeness of this information.
Any material provided does not have regard to the specific investment objective and financial situation of any person who may receive it. Past performance is not a reliable indicator of future performance. AT provides an execution-only service. Consequently, any person acting on the information provided does so at their own risk.