
I am often asked by people what my favourite technical signal or indicator is.
The answer to that is it's the one that’s working for me at the time, the one that suits the current market conditions and which provides the most information to me.
Recently that’s been the golden cross which is simply the crossover of two moving averages where a faster-moving or shorter-term MA line crosses up through and above its slower-moving longer-term counterpart.
When we see a golden cross formed it’s often an indicator of upward price momentum in the instrument that we are charting.
Barchart.com
The steepness of the ascent, of the faster-moving MA line can also shine a light on how quickly momentum is building.
So what exactly are moving averages and why are they useful and informative?
Moving averages are one of the most popular and widely used technical indicators within financial market analysis.
A moving average is plotted as a line on a chart, and traders like to use these lines because they smooth out price fluctuations, or market noise, and show the underlying trend in a stock or index more clearly.
Two of the most common moving averages, used by longer-term traders, are the 50-day and 200-day moving averages.
The 50-day moving average is used to provide a medium-term outlook and the average is calculated by summing the closing prices over the previous 50 trading days and dividing that number by 50.
When the price of a stock crosses above its 50-day moving average, it's considered a bullish signal which shows that the uptrend is strengthening.
Conversely, if the price falls below the 50-day moving average, it indicates that any downtrend could be intensifying.
The 200-day moving average provides a longer-term perspective of the trends, if any, in an underlying instrument.
To calculate the 200-day MA we simply add up the closing prices from the previous 200 trading days and divide that number by 200.
The 200-day moving average acts as an important support and resistance level for long-term investors and traders.
A break above the 200-day moving average is seen as a definitive bullish breakout while a drop below this level is a strong bearish signal.
Multiple Moving Averages
Traders use moving averages over a variety of time frames, but in most cases, they will use multiple MA lines in combination.
Typically there will be a shorter, faster moving or more frequently updated line, paired with one or two longer-term lines, which are updated less frequently.
To put that into context a 5-day moving average is completely refreshed every 5 trading days whilst a 20-day moving average is updated over a 20-day cycle, or four times less frequently than its 5-day counterpart.
Traders can combine moving averages with other technical indicators like volume and price patterns. Using these combinations traders can gain valuable insight into the current trend and potential turning points in the price action.
Highlighting and paying attention to moving average crossovers can help traders spot opportunities in the market, in both directions.
Too simplistic to be useful?
A criticism levelled at moving averages, and the signals they produce, is that they are somehow too simplistic to be useful to traders. And, because of that the market must have anticipated the information the averages contain, and have priced that in already.
My thoughts on that are two-fold:
Firstly if there is a simplistic solution that works then why try to add in complexity?
Secondly, critics who suggest that the market will have priced in the information contained within the moving averages are giving the market far too much credit.
Yes, it's true that a golden cross, in which a faster-moving or shorter-term moving average crosses up through a longer-term moving average isn’t the strongest of signals in isolation.
But it can become much more powerful if it's combined with other signals and indicators to provide confirmation, which of course, is one of the most important words in trading.
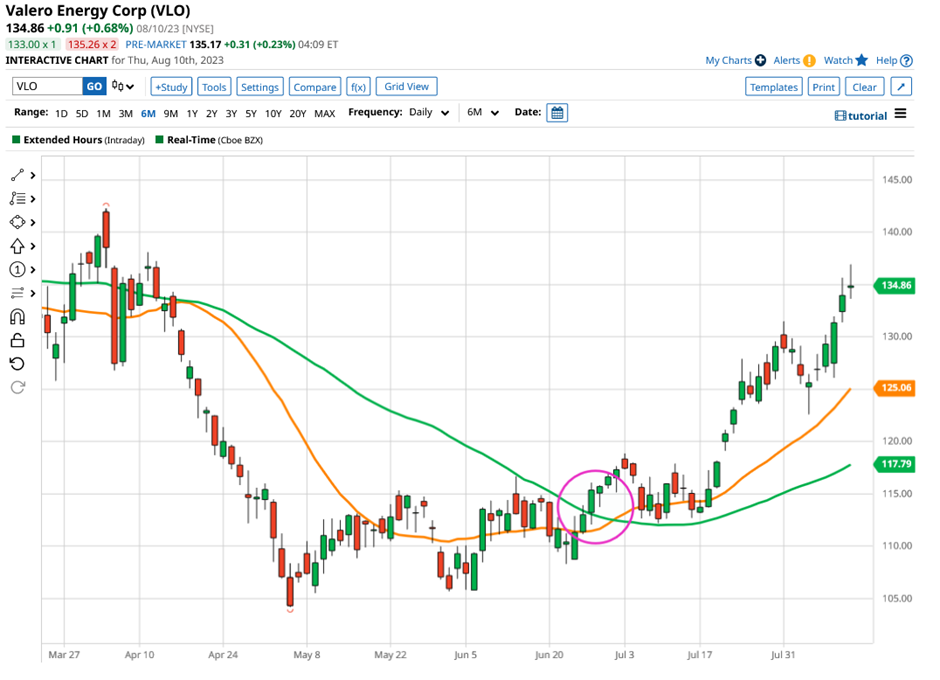
Here’s a near-textbook example of what I am talking about. The chart is of the US refining company Valero Energy Corp (VLO) we can see the price moving sideways in May and June, following a sharp sell-off in the stock during April.
Barchart.com
Things changed in the later part of June, however, as the price began to appreciate once more and crossed up through both the 20 and 50-day MA lines Shown in green and orange respectively. A positive signal in itself.
What happened next confirmed that change was afoot when the faster-moving 20-day MA line crossed up and through its slower-moving 50-day counterpart.
In the period between June 20th and August 10th, Valero’s share price rose by just over +21.50%.
Is that a one-off?
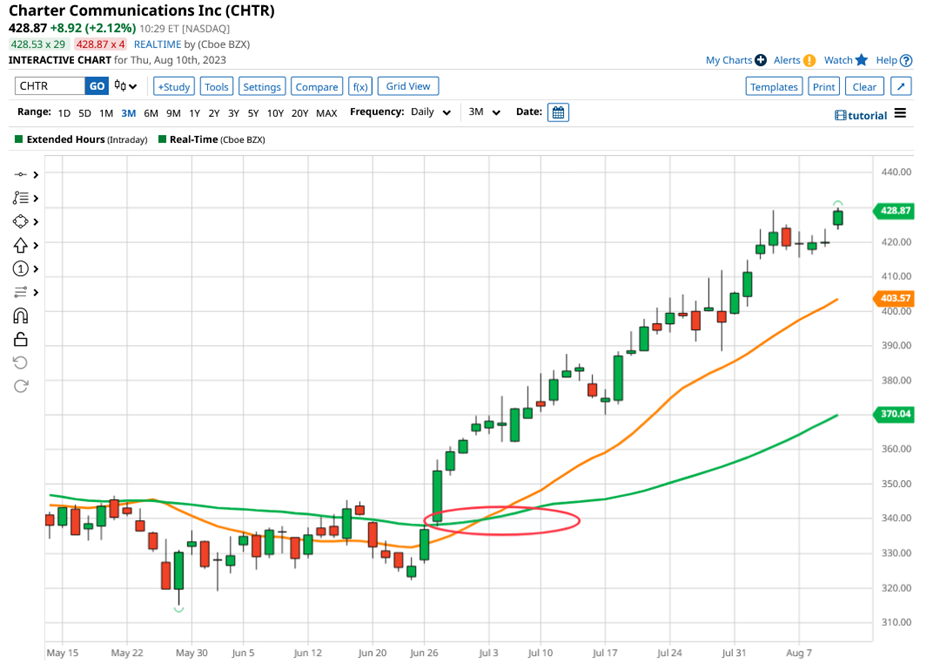
Well, take a look back at the chart of Charter Communications (CHTR) at the start of the article and you will see very similar price action at work.
Between June 30th and August 10th Charter Comm's share price added 16.58%.
Moving averages and golden crosses are not the keys to successful trading on their own, but spotting these signals, soon after they occur, provides a good starting point and can create a list of stocks or other instruments for you to watch, which is exactly how I came up with the two examples above.
The information provided does not constitute investment research. The material has not been prepared in accordance with the legal requirements designed to promote the independence of investment research and as such is to be considered to be a marketing communication.
All information has been prepared by ActivTrades (“AT”). The information does not contain a record of AT’s prices, or an offer of or solicitation for a transaction in any financial instrument. No representation or warranty is given as to the accuracy or completeness of this information.
Any material provided does not have regard to the specific investment objective and financial situation of any person who may receive it. Past performance is not a reliable indicator of future performance. AT provides an execution-only service. Consequently, any person acting on the information provided does so at their own risk.