
Trading and investing are two very different things even though both involve speculation in the financial markets and share the same ultimate goal of making money.
Some of the obvious differences between the two disciplines include:
Time horizons: Traders typically have a shorter time horizon than investors. Traders may hold an asset for days, or weeks, while investors may hold an asset for years or even decades.
Risk tolerance: Traders typically have a higher risk tolerance than investors. Traders are willing to take on more risk in exchange for the potential for higher returns. Investors, on the other hand, are typically more risk-averse and are willing to accept lower returns in exchange for that lower risk, or at least to spread that risk over much longer time frames.
Trading strategies: Traders use a variety of strategies to make money, including technical, fundamental, and market sentiment analysis. Investors, on the other hand, typically use a qualitative approach to asset selection and a buy-and-hold strategy, which means they buy an asset and hold it for the long term.
Knowledge base: Trading requires a deep understanding of the market and the ability to make quick decisions. Investors, on the other hand, do not necessarily need to have as deep an understanding of the market and can make decisions over longer time frames by say looking at historical fundamental or earnings data.
Required resources: Trading can require a significant amount of time and money. Investors, on the other hand, can start with a smaller amount of time and money by for example investing a regular sum every month.
Despite those differences, traders can learn from investors or more specifically they can benefit from studying what they do and how they behave.
Of course, we can't hope to track the behaviour of individual investors but we can watch what institutional investors are doing and in some cases what retail investors are doing in aggregate.
A recent real-world example
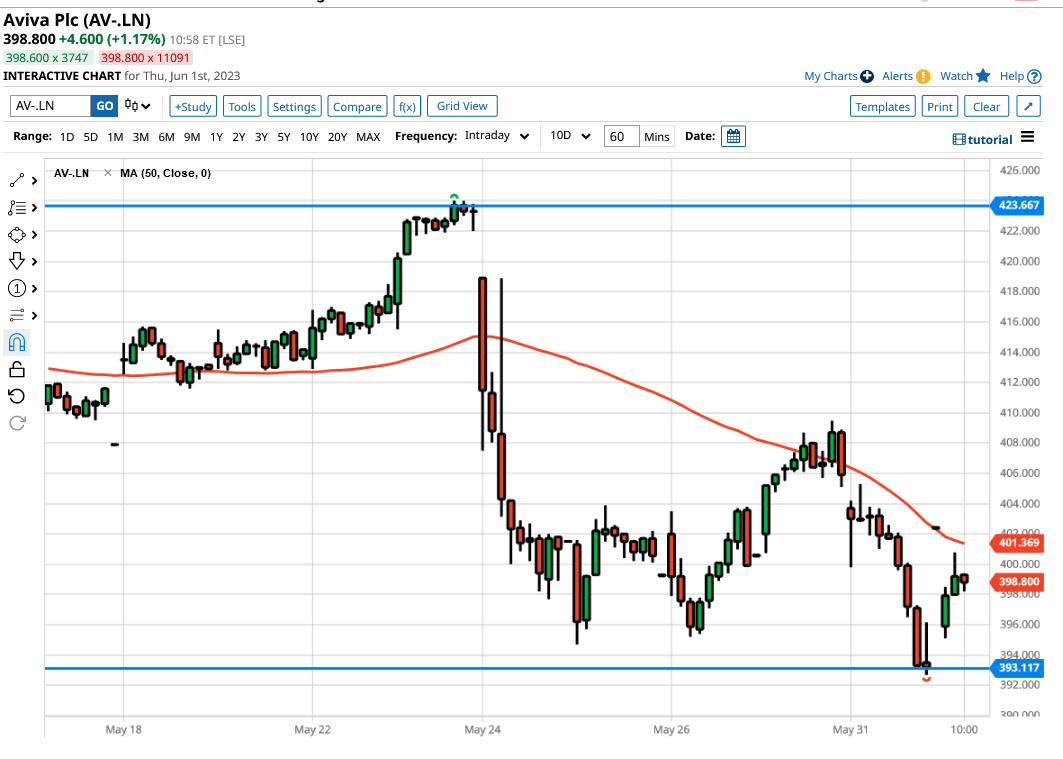
Norwegian activist investor Cevian Capital took a stake in UK insurer Aviva (AV.) back in 2020 amassing as many as 150 million shares in the company, while lobbying the management for shareholder value and returns of excess capital to equity investors.
Aviva obliged and returned £5.0 billion pounds of cash to stockholders, since 2021.
However last week Cevian announced that it had sold the majority of its holding in Aviva.
That news coincided with a trading update from Aviva itself.
The combination of those two events created an 8% swing in the Aviva share price as highlighted in the chart below.
What’s more the price action threw up more than one trading opportunity with a chance to sell the stock following the gap down at the open on May 24, and the subsequent break of the 50 period (hour) MA line. A failure at which, created a second selling opportunity a few days later, on May 30th.
Looking for clues in the data
Keeping an eye on which stocks institutional investors and hedge funds are buying or selling can be a useful source of market intelligence.
In the UK institutions have to declare their equity short positions under FCA regulations, and that means it's possible to track what these funds are up to and there are several websites dedicated to doing just that.
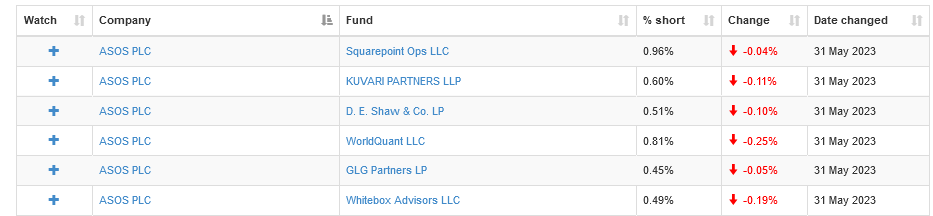
For example here is a table from https://shorttracker.co.uk/ that shows us recent changes in the short positions held by half a dozen hedge funds in online retailer ASOS (ASC).
Judging by this chart shorting ASOS has been a profitable trade for the hedge funds with the ASOS price falling by more than -50% in the last month alone.
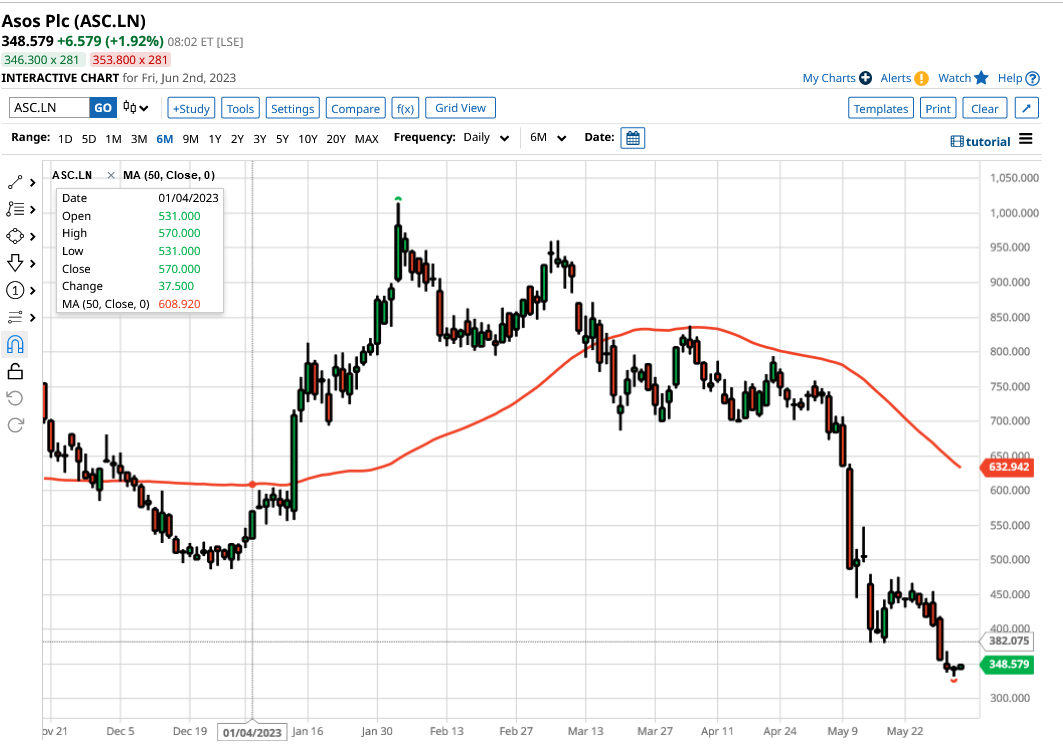
However, looking at the data in the table we can see that the hedge funds have been reducing their short positions. And that reduction coincides with the appearance of a hammer in the daily candle chart, a pattern which is said to show the price is hammering out a bottom.
Now like most candlestick patterns a hammer needs confirmation or in other words, the price action needs to show us that the stock price wants to bounce from the lows. So this isn't a buy signal in and of itself.
Rather it gives us a reason to watch the stock because if the stock does start to rally (it's up +2.66% as I write) might we see a bit of a short squeeze as the hedgies look to take more of their position off of the table?
Of course, as retail traders, we can’t know what these hedge funds will do, but in a situation like this, we can make an educated guess. And that is really what trading is all about - using your intuition to find and interpret setups in the market and then taking a calculated risk by backing your thoughts through a position.
The information provided does not constitute investment research. The material has not been prepared in accordance with the legal requirements designed to promote the independence of investment research and as such is to be considered to be a marketing communication.
All information has been prepared by ActivTrades (“AT”). The information does not contain a record of AT’s prices, or an offer of or solicitation for a transaction in any financial instrument. No representation or warranty is given as to the accuracy or completeness of this information.
Any material provided does not have regard to the specific investment objective and financial situation of any person who may receive it. Past performance is not a reliable indicator of future performance. AT provides an execution-only service. Consequently, any person acting on the information provided does so at their own risk.