
A simple software update created havoc last week and showed us how dependent we all are on a tight-knit group of cloud computing and cybersecurity providers.
Glitches in the software update, and subsequent knock-on effects they created, affected banking, healthcare, travel and transportation, retailers and many other industries. And though the cause was identified and corrected, relatively quickly, the aftermath is still ongoing.
What we saw on Friday was a classic example of risk concentration in this case too much critical infrastructure being too reliant on a small pool of IT service providers.
Still, the idea of risk concentration transfers directly to the financial markets as well.
Parallel lines
And the parallels don’t stop there either, because, as I have previously noted, investors have become increasingly reliant on the performance of a narrow group of stocks (the Magnificent Seven) to generate their returns.
Ironically, three of those stocks, Microsoft, Amazon and Google (Alphabet) happen to be cloud computing providers.
Shares in Crowdstrike (CRWD) the Cybersecurity business whose update kickstarted the outage, sold off by -11.00% on the day and were called lower once more on Monday as well.
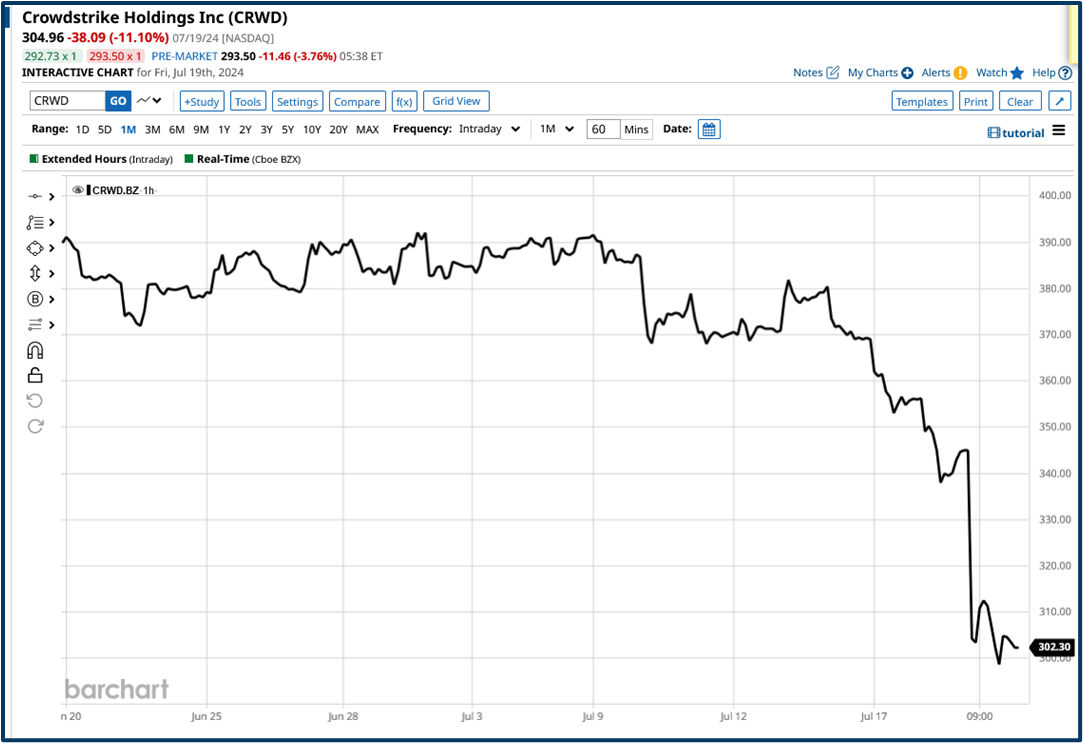
Source: Barchart.com
There might be a silver lining to all this, however, because it could mean that investors and traders sit up, and think about what risk-concentration and over-dependence really mean to them.
And that pause for thought probably couldn’t have come at a better time.
Overhyped and overvalued?
In the article Rotation and Concentration, I looked at how traders and money managers were starting to put money into areas of the market other than large-cap equities and the fact that it was small and mid-cap stocks that were benefitting from this change of heart.
Recent research from strategists at Bank of America suggests that the S&P 500 is now looking expensive on 19 out of 20 statistical measures and trading well away from historical averages in many instances as you can see in the table below.
According to BofA data S&P 500 stocks are trading some +64.7% above their historical average trailing PE, they have a price-to-book value that is 87% higher than the long-term average.
Whilst the ratio between the dividend yield of the S&P 500 and the yield from 10-year US Treasury Bonds is some -76.40% below the average of data collected since 1792.
Viewed in isolation, none of these things is damning in itself. However, when these indicators and their deviations from long-term averages are viewed collectively then we should take note.
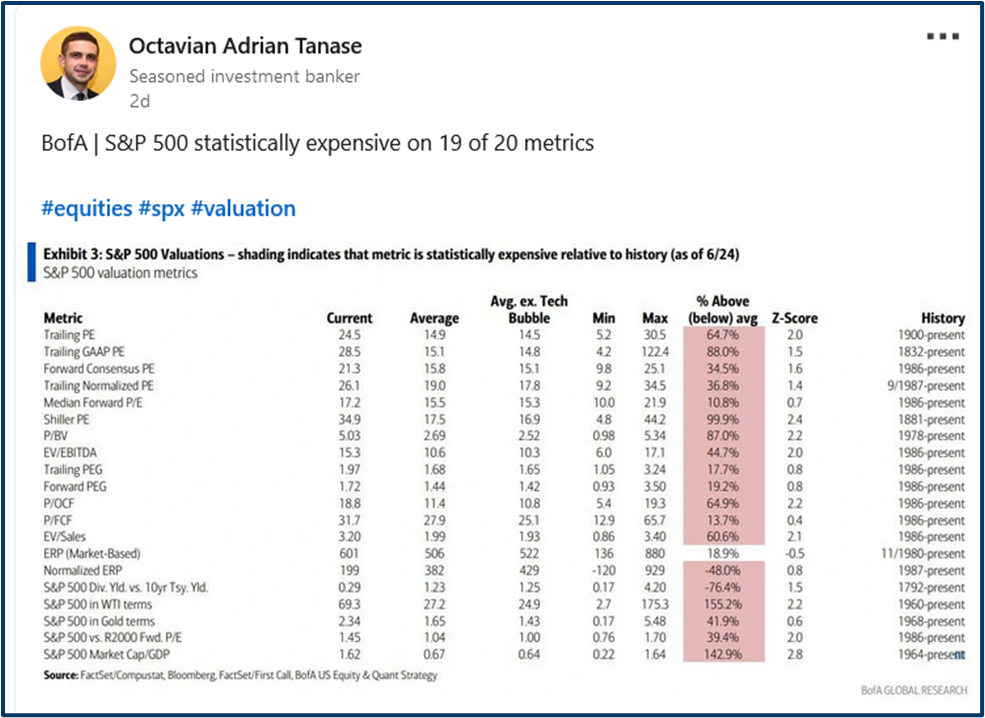
Source: BofA/LinkedIn
Positive earnings growth?
Of course, if earnings and profitability among S&P 500 stocks were growing strongly, then above-average readings in the BofA indicators might just be justified.
As luck (or fate?) would have it we are slap bang in the middle of Q2 earnings season for S&P 500 stocks.
The early omens are positive 14% of the index had reported, as of the close on Friday, July 19th.
And 80% of those companies have reported an upside earnings surprise, while 62.0% have beaten on revenues, according to data compiled by Factset.
Factset calculates that the blended earnings growth rate (estimates plus actual results) for Q2, among S&P stocks is running at +9.70% and if that were the earnings growth rate for the quarter it would be the best performance since Q4 2021.
Earnings from three of the Magnificent Seven stocks are due out shortly (see below) though Nvidia isn't reporting until much later in August.
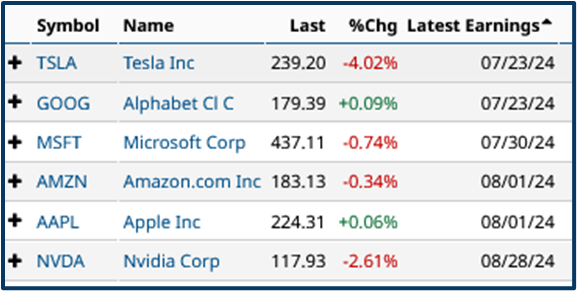
Source: Barchart.com
Head in the sand
What we can't afford to do however, is put our head in the sand and hope it will all be ok, because, as we can see in the charts below momentum and confidence in the Information Technology and Communication Services sectors, which have been driving the markets higher in 2024, has fallen sharply.
Information Technology has seen the biggest drop in momentum, as measured by the percentage of stocks trading above key moving averages.
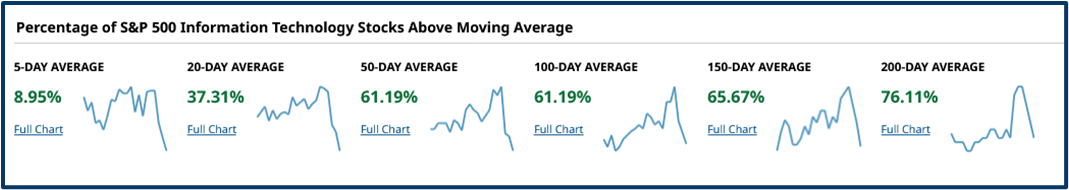
Source: Barchart.com
However, there has also been a visible downturn in the fortunes of Comms Services stocks, particularly at the shorter end.
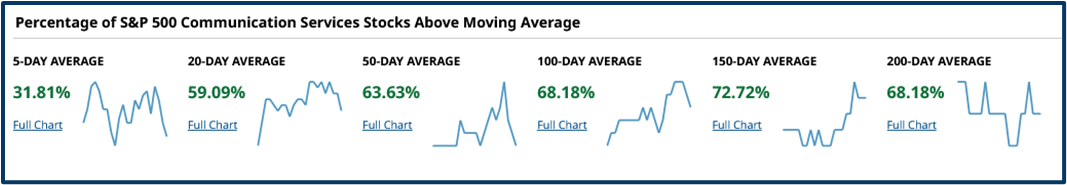
Source: Barchart.com
The tell
Perhaps most tellingly (in a market which has been all about momentum since October 2022) is the decline in the number of new, year-to-date highs in the Information Technology sector, which has fallen sharply over the last week.
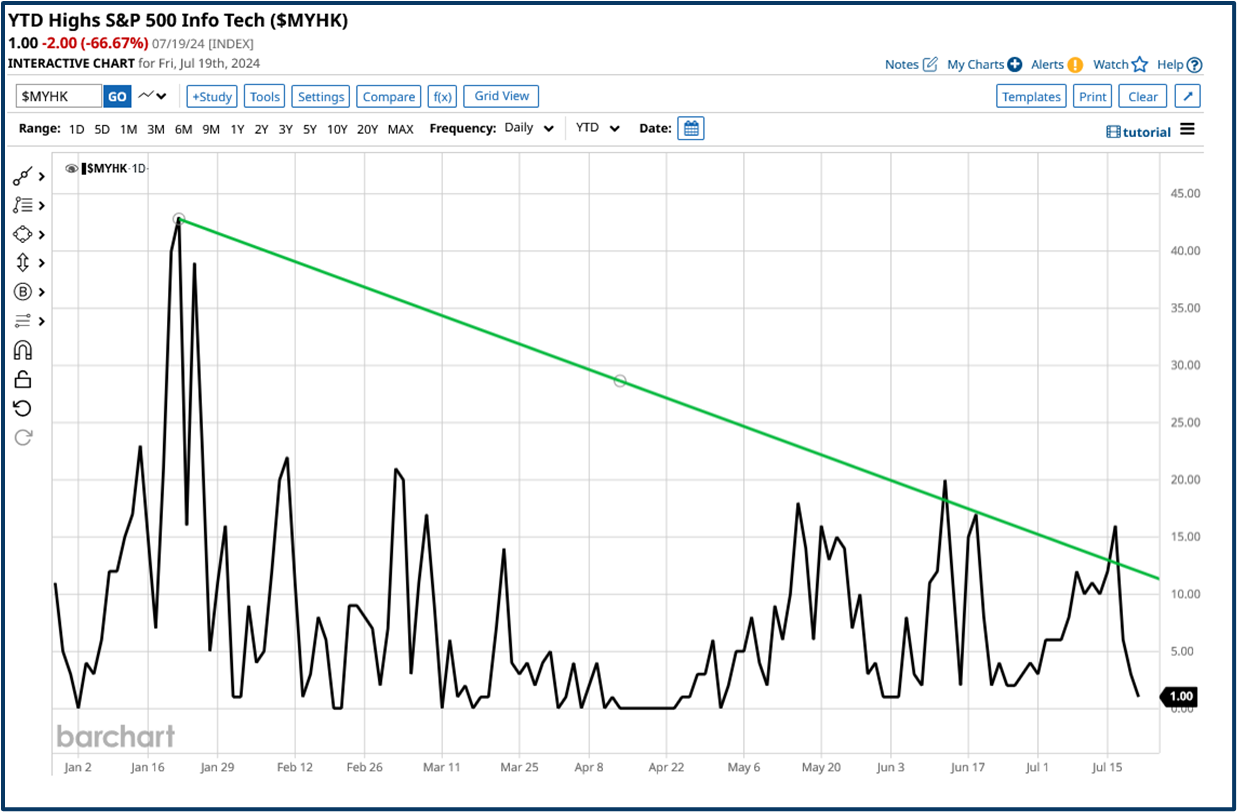
Source: Barchart.com
Remember that uptrends are defined as being a series of higher highs and higher lows within the price action.
And, if we are not seeing fresh highs, then the validity of the uptrend is being called into question.
That's not to say that the bull market is over or even winding down, but it does acknowledge that it’s a possibility and where cracks may start to show.
After all, it's always far better to be aware of these possibilities ahead of the event, so we can be proactive in our decision-making, rather than being reactive, after the event.
The information provided does not constitute investment research. The material has not been prepared in accordance with the legal requirements designed to promote the independence of investment research and as such is to be considered to be a marketing communication.
All information has been prepared by ActivTrades (“AT”). The information does not contain a record of AT’s prices, or an offer of or solicitation for a transaction in any financial instrument. No representation or warranty is given as to the accuracy or completeness of this information.
Any material provided does not have regard to the specific investment objective and financial situation of any person who may receive it. Past performance is not a reliable indicator of future performance. AT provides an execution-only service. Consequently, any person acting on the information provided does so at their own risk.