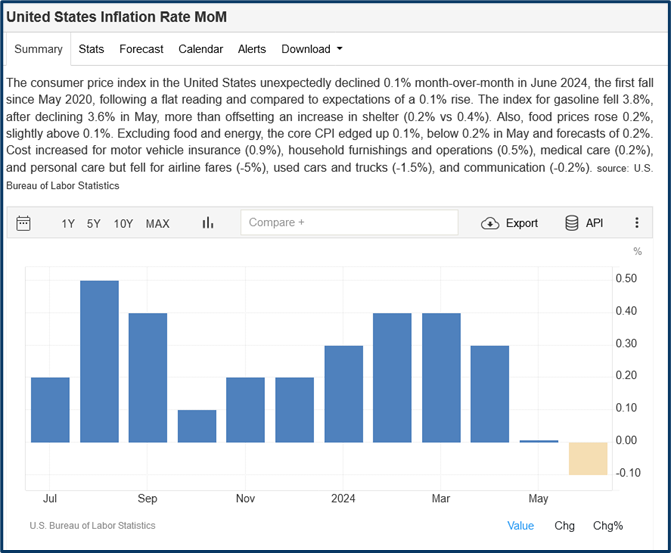
The markets are moving or should that be shifting? I say shifting as recent price moves have come about, because of a shift in the interest rate narrative, with the market now fully embracing the idea of a cut in US interest rates, following the release of weaker US inflation data, for June 2024.
In fact by some measure, the prices of goods and services in the US actually fell last month, as opposed to not going up as quickly, which is what we have seen to date. See the data below.
Source:Trading Economics
Positioning in Fed Funds futures suggests that more than 85% of traders are looking for a rate cut of -0.25% in September, with 60% looking for a further -25 basis point cut come November.
I remain sceptical but that’s largely irrelevant, because what the market thinks is what matters, simply because that’s what drives price change.
Big price moves
And we have certainly seen price changes as traders and investors gravitate to interest rate sensitive stocks and sectors in a process known as rotation.
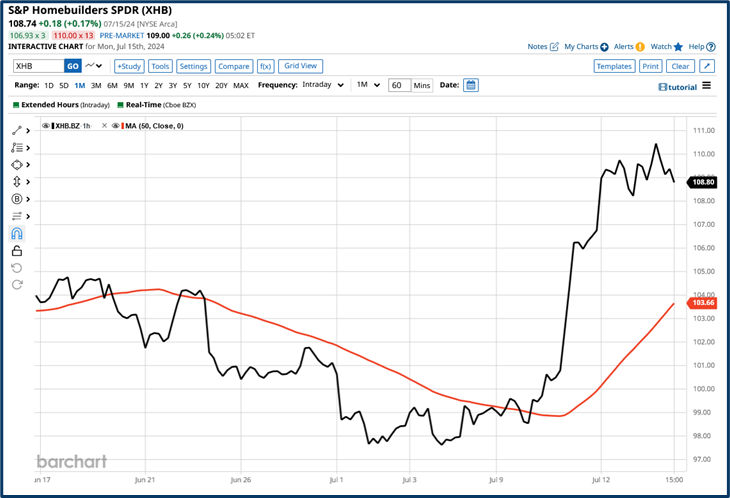
A prime example was the US home builders, the sector ETF XHB rose by over+ 9.50% in the last week, as you can see in the chart below.
Source:Barchart.com
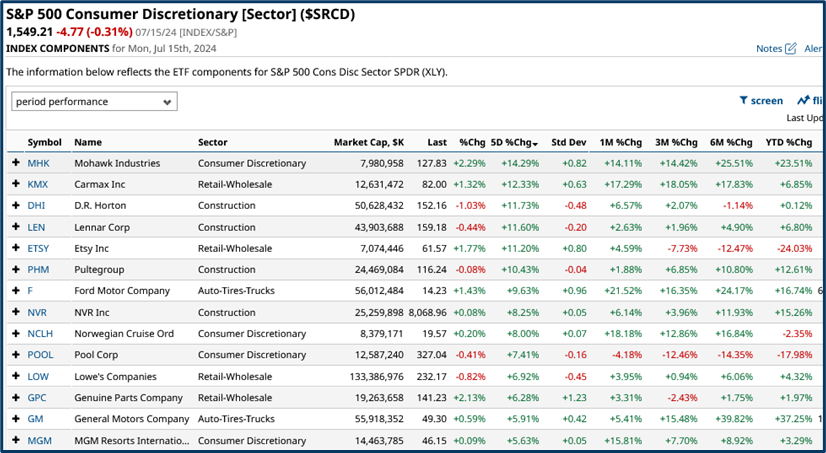
The housebuilders were some of the biggest gainers, among the wider S&P 500 Consumer Discretionary stocks.
Source:Barchart.com
The gains haven’t been confined to stocks that should benefit from heightened consumer spending either.
in fact, some of the biggest gains have come from stocks whose finances are seen as benefiting from rate cuts, which is a subtle but important distinction.
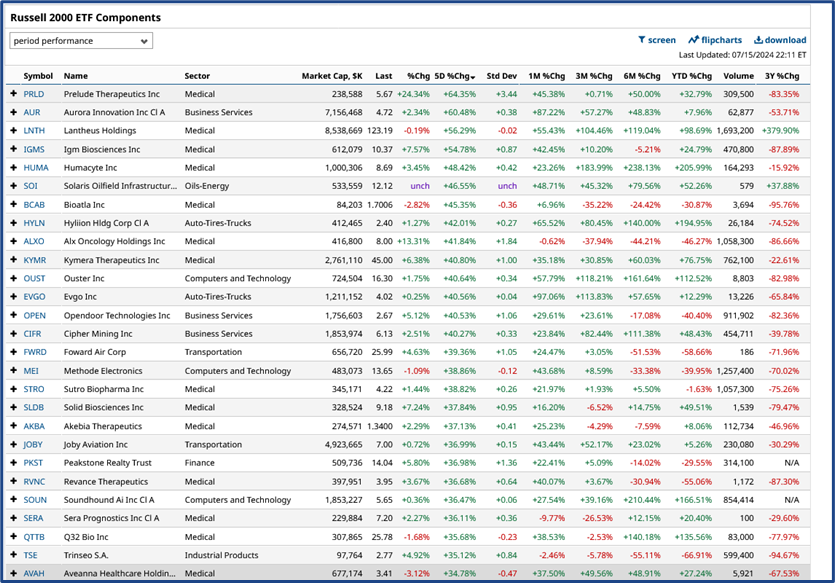
The Russell 2000 index which tracks the performance of the largest 2000 US stocks rallied by 7.37% but there are plenty of stocks with in the index that have posted significant weekly percentage gains
Though whether all of those gains can be laid at the door of a more dovish interest rate environment is debatable.
Sometimes the market favours a broad-brush approach and leaves filling in the detail until later.
Source:Barchart.com
Broad brush strokes
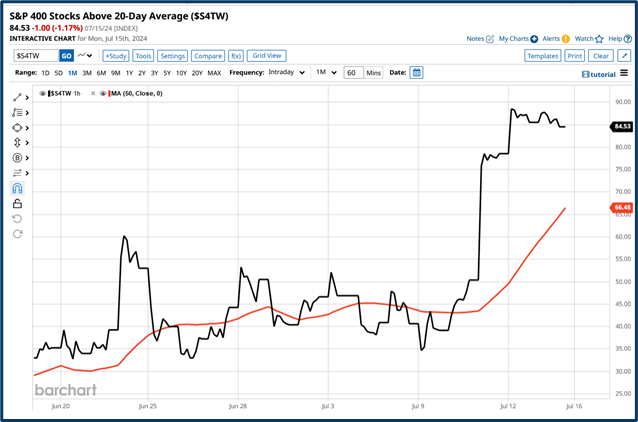
We can see further evidence of that broad-brush approach in this chart of the percentage of stocks in the S&P 400 Midcap index, trading above their 20-day moving average.
The indicator leapt from a reading of 35% to over 88.0% in just a couple of days.
Source:Barchart.com
What have people been rotating out of?
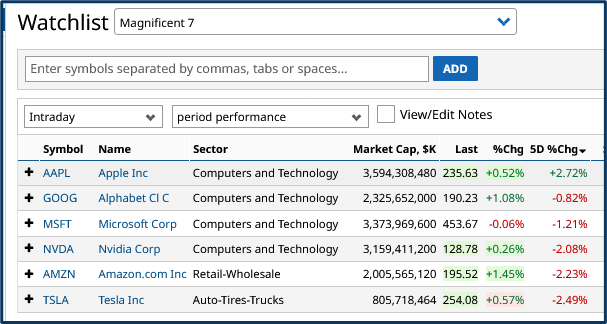
To some extent it’s been the very stocks that have driven the market higher during 2024. Many of the Magnificent 7 stocks have stopped going up, and are down over the prior week as of the time of writing.
Source:Barchart.com
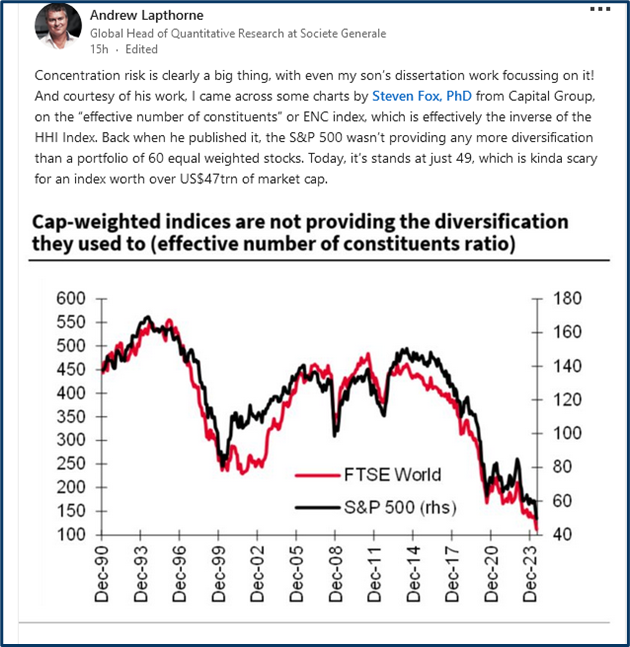
It's these stocks which are behind the concentration in the markets which was highlighted by Societe Generale’s Global Head of Quantitative Research in this recent LinkedIn post:
Source: LinkedIn/SG Research
The upshot of which is that the 500 stock strong S&P index has become a slave to the fortunes of just a handful of stocks and that’s dangerous because it overrides the idea of diversification within a portfolio.
Because this level of concentration says you can hold as many different stocks as you like but it won't make any difference as it’s the Magnificent Seven and other mega-cap stocks, that will dictate what happens next.
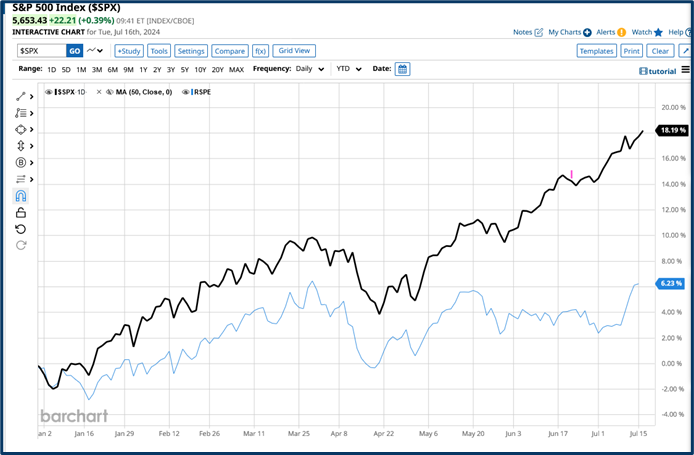
We can see the impact these mega-caps are having on the market in this chart which plots
the YTD percentage change in the cap weighted S&P 500, in black, versus RSPE an ETF which tracks an equal weight version of the index, in blue.
Source:Barchart.com
Of course that's not something people will worry about while the prices of the select few are rising but if and when the mood music changes, or even stops, then it could quickly become a very big problem indeed.
The information provided does not constitute investment research. The material has not been prepared in accordance with the legal requirements designed to promote the independence of investment research and as such is to be considered to be a marketing communication.
All information has been prepared by ActivTrades (“AT”). The information does not contain a record of AT’s prices, or an offer of or solicitation for a transaction in any financial instrument. No representation or warranty is given as to the accuracy or completeness of this information.
Any material provided does not have regard to the specific investment objective and financial situation of any person who may receive it. Past performance is not a reliable indicator of future performance. AT provides an execution-only service. Consequently, any person acting on the information provided does so at their own risk.