
High, Low, Open, Close
Four short words that, despite their simplicity, are integral to trading and the analysis of price trends.
When we use those words as categories and apply them to the price history of an instrument, they become incredibly powerful and informative to those who know how to interpret them.
And the best way to do that is to visualise them
The graphic below shows the price range in German engineer and steel maker, Thyssenkrupp TKA GR, on December 9th 2025, when it reported its Q4 2025 earnings.
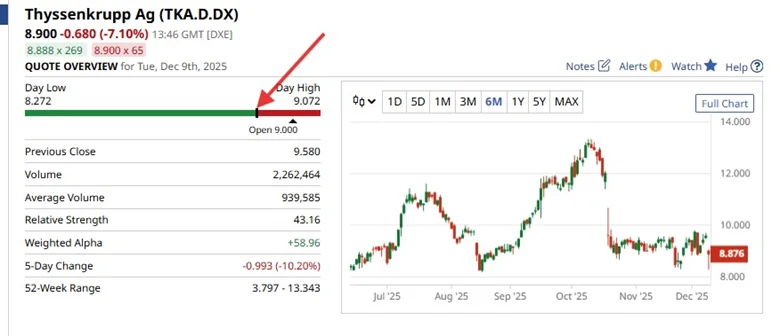
Thyssenkrupp effectively issued a profits warning, saying that it would generate a net loss of -€800.0 million for the financial year ending September 2026.
Thanks to a combination of restructuring costs and losses incurred by its steel-making operations, which are up for sale.
Thyssenkrupp stock, which trades under the ticker TKA GR, has rallied by some +58.0% since mid-August
These shares had an intraday range of -9.0% on that news, which is perfectly captured and visualised by the slider shown and highlighted in the image above.
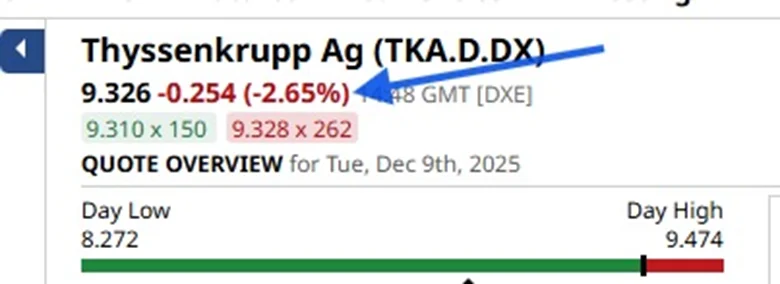
Now consider the image below. Thyssenkrupp has rallied by +4.35% and is down by just -2.65% compared to the -7.10% drop in the image above.
Source:Barchart.com
I shared these graphics with members of my Idea Factory chat group on December 8th a 14.01 and 15.04 London time, respectively
Having posted this chart at 14.00 with the comment
“Thyssenkrupp TKA are firming up “
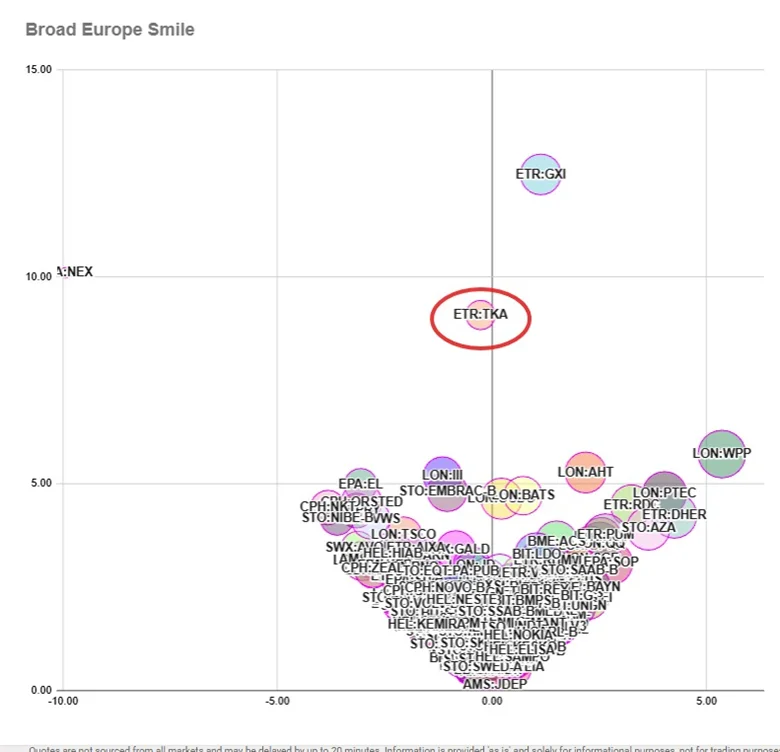
Always smiling
The smile charts are my own invention, and they track relative price action strength among a universe of stocks, in this case, large-cap European equities.
Before this point, TKA GR had been firmly on the left side of the chart, an area which indicates relative weakness.
However, as you can see below, by 14.00 on December 9th, the stock had started to “knock on the door” of the right-hand side of the chart, the area that signifies price action strength.
Source: Darren Sinden
If you look just above and to the right of TKA, on the smile chart.
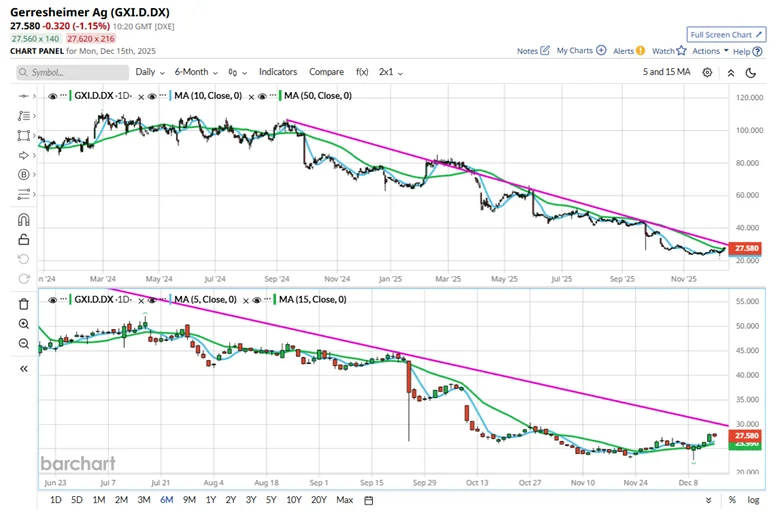
You will see GXI GR Gerresheimer AG, which makes specialist packaging for the pharmaceutical and cosmetics industries.
GXI has had a tough 2025, and no mistake, but perhaps there are signs of life in the stock.
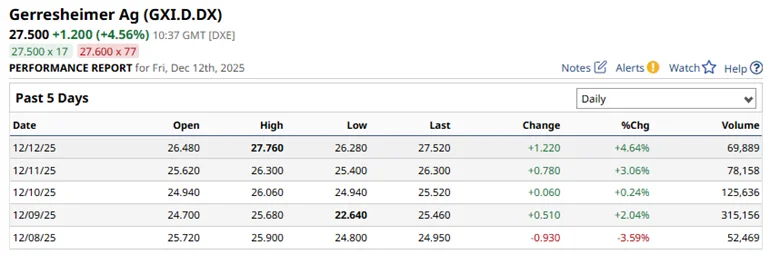
Examples of which include its positioning on the Smile chart above, and the run of four consecutive up days shown in the table below.
Source:Barchart.com
In three out of the four instances above, the last price (closing level) was close to,or was the high of the day.
Source:Barchart.com
Those are the kind of signals that suggest it's a stock worth watching, so I’ll set price alerts and check in on the chart periodically from here.
Reversing the charges
When I was a child, public payphones were commonplace and widespread.
My parents taught me and my brother that, if we found ourselves in some sort of trouble, we could call home via the operator, even if I didn't have any money, by “reversing the charges” - our home phone number would pick up the tab for the call. So we need never be out of touch.
Reversals are a powerful tool in trading, too.
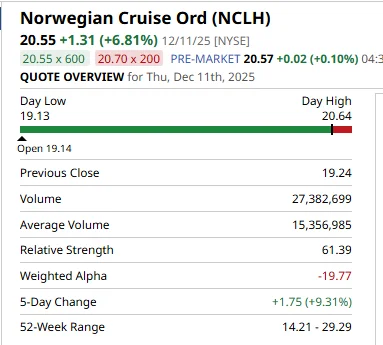
Here is another example of how the slider (High, Low, Open, Close) provides us with an instant insight into what's happening in a stock, in this case, Norwegian Cruise Line Holdings NCLH US.
Goldman Sachs downgraded NCLH on December 9th over what it called “ Heavy exposure to a softening Caribbean Market “, something that I felt could see the stock sell off.
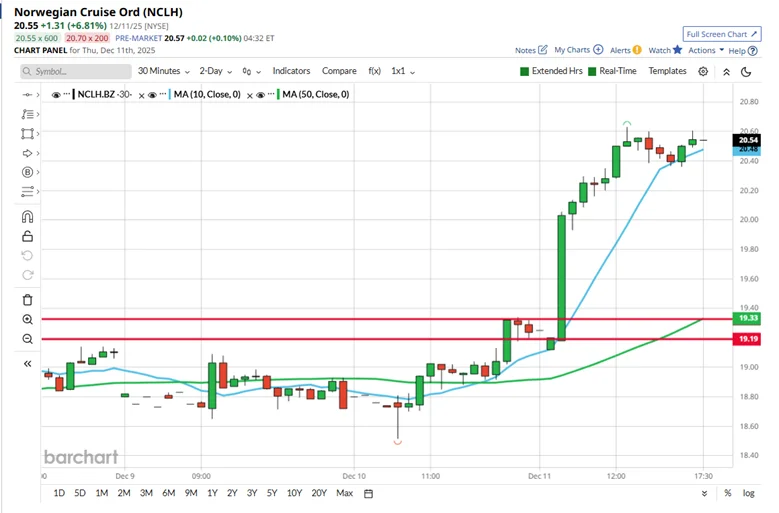
However, we got the exact opposite, as you can see below.
The stock moved sideways on the GS downgrade and then jumped sharply higher on Dec 11th and continued to push on on the 12th.
The slider below, from the 11th Dec, shows us exactly what happened here, the open and the low are just a cent apart, and the stock had closed just 9 cents below the day's high, and $1.31 above the open and $1.32 above the low.
Source:Barchart.com
When the market shows you that your view, or thoughts on a stock, are wrong, you should take notice.
Source:Barchart.com
Far from selling off, NCLH US put on +10.25% last week, buoyed by news of a $2.0 billion stock buyback at rivals Royal Caribbean, and the hopes of a rate cut by the Federal Reserve, which, of course, is what we got.
When we study the High, Low, Open, Close levels in an instrument and their relationship to each other, what we are really doing is determining which group (buyers or sellers) had the upper hand and how forcefully they were able to push home their advantage, if indeed there was one.
In doing so, we are opening a window into the mindset, intentions and outlook of traders in that instrument, and that means that we can start to make an educated guess about what comes next.
In the end, successful trading is about slanting the odds in a trade in your favour, which we can do by taking on trades that have a high probability of success.
The better we become at scanning the lay of the land in a stock and working out in which direction the path of least resistance points, the more likely we are to be able to achieve that goal by picking winners and missing out on losers.
The information provided does not constitute investment research. The material has not been prepared in accordance with the legal requirements designed to promote the independence of investment research and as such is to be considered to be a marketing communication.
All information has been prepared by ActivTrades (“AT”). The information does not contain a record of AT’s prices, or an offer of or solicitation for a transaction in any financial instrument. No representation or warranty is given as to the accuracy or completeness of this information.
Any material provided does not have regard to the specific investment objective and financial situation of any person who may receive it. Past performance is not a reliable indicator of future performance. AT provides an execution-only service. Consequently, any person acting on the information provided does so at their own risk. Forecasts are not guarantees. Rates may change. Political risk is unpredictable. Central bank actions may vary. Platforms’ tools do not guarantee success.