
The stock market is a dynamic and complex system, where prices are constantly in flux.
Among theses various price levels and movements, new price highs and lows can impart important information to traders.
These levels can tell us a great deal about current market sentiment, and can help us in making informed trading decisions.
New price highs refer to the highest price a stock has reached within a specific timeframe, while new price lows represent the lowest price within that same period.
Each of these developments can create inflexion points in the price action, that traders should pay attention to.
What do new price highs or lows mean?
New price highs are typically associated with bullish market sentiment and can indicate strong investor confidence in a company's prospects.
When a stock price reaches a new high, it may attract more buyers, leading to a positive feedback loop that can drive the price even higher.
Conversely, new price lows can signify bearish market sentiment, as investors sell off their holdings due to concerns about a company's performance or the broader market conditions.
The traders' job is to interpret those signals and to make a judgement based on their validity or strength.
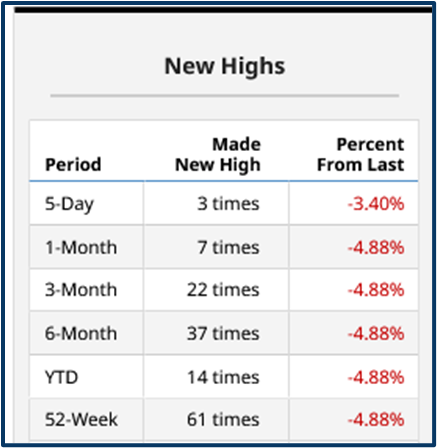
Keeping track of the number and frequency of new highs can give traders a feel for the strength of a trend. The table below suggests that momentum in the Information technology sector has been cooling off.
S&P 500 Information Technology sector new period highs as of 21-02-2024
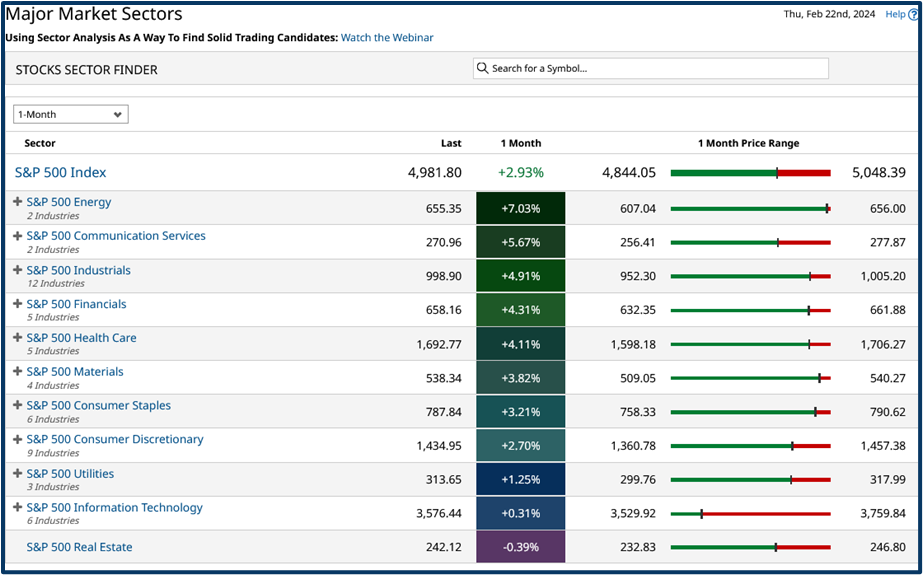
If we then look at this 1-month performance table we can clearly see that's been the case, with the IT sector index (second from bottom) being much closer to the 1-month low, than the 1-month high in the price range (right hand column).
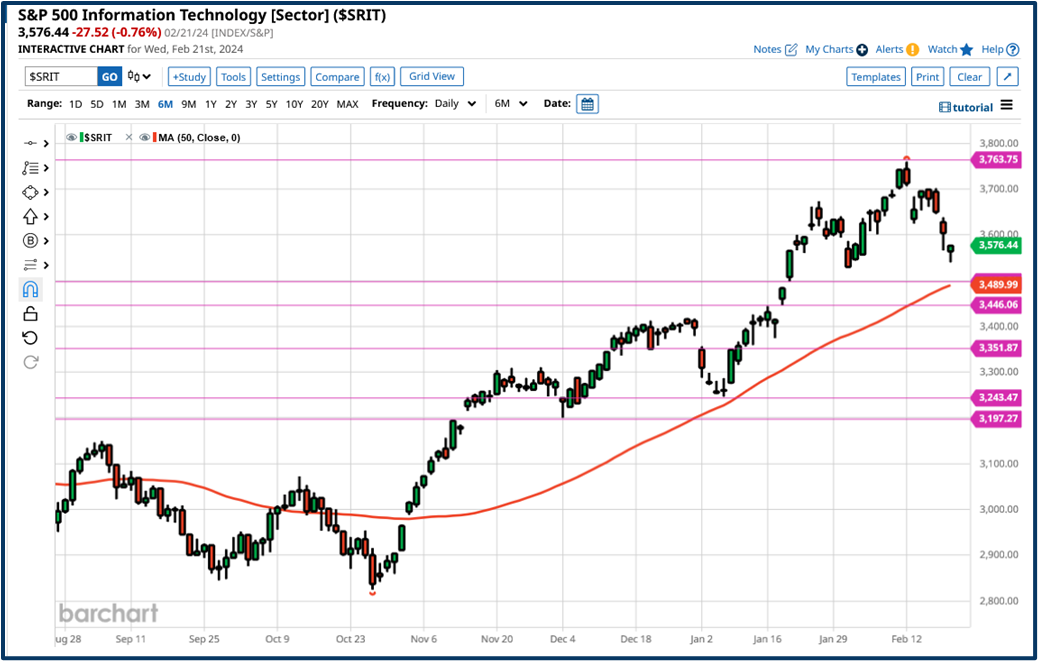
A chart can visualise this for us
If we plot high and low points in the price action on a chart, as I have done below using the magneta horizontal lines. We can quickly visualise where support and resistance might be found.
And by doing this we get an immediate sense of what the price action is telling us, what the current trend is, and what needs to happen for that to change.
And once we know that we are very well informed indeed.
Note the hammer candle formation on the right hand side of the chart.
A candle pattern which suggests that the price action is hammering out a bottom, in anticipation of a bounce. In this case that’s likely to be provided by the recation to blow out earning at Nvidia.
Why it’s worth spending your time looking for, and paying attention to new highs and lows
Monitoring new price highs and lows can aid traders in several areas:
1. Identifying Trend Reversals:
New price highs and lows can be early indicators of trend reversals. For instance, a series of consecutive new highs followed by a lower high might suggest that the uptrend is weakening, and a trend reversal may be imminent. Conversely, a series of new lows followed by a higher low could indicate that a downtrend is losing momentum, and a potential reversal might be on the horizon.
2. Breakout Trading:
New price highs and lows can also be used to identify breakouts, where a stock price breaks through a key resistance or support level. Traders can use these breakouts to enter or exit positions, as they often lead to continued price movements in the same direction. This type of analysis form the basis of much momentum trading, or trend following among traders.
3. Risk Management:
Monitoring new price highs and lows can help traders manage risk more effectively. For example, if a stock reaches a new high, a trader who is long on the stock might consider setting a stop-loss order at a level below the new high to protect profits or limit potential losses.
4. Sentiment Analysis:
New price highs and lows can offer insights into market sentiment and help traders gauge the overall mood of investors. This information can be used to inform trading decisions and adjust strategies accordingly.
Discovering opportunities
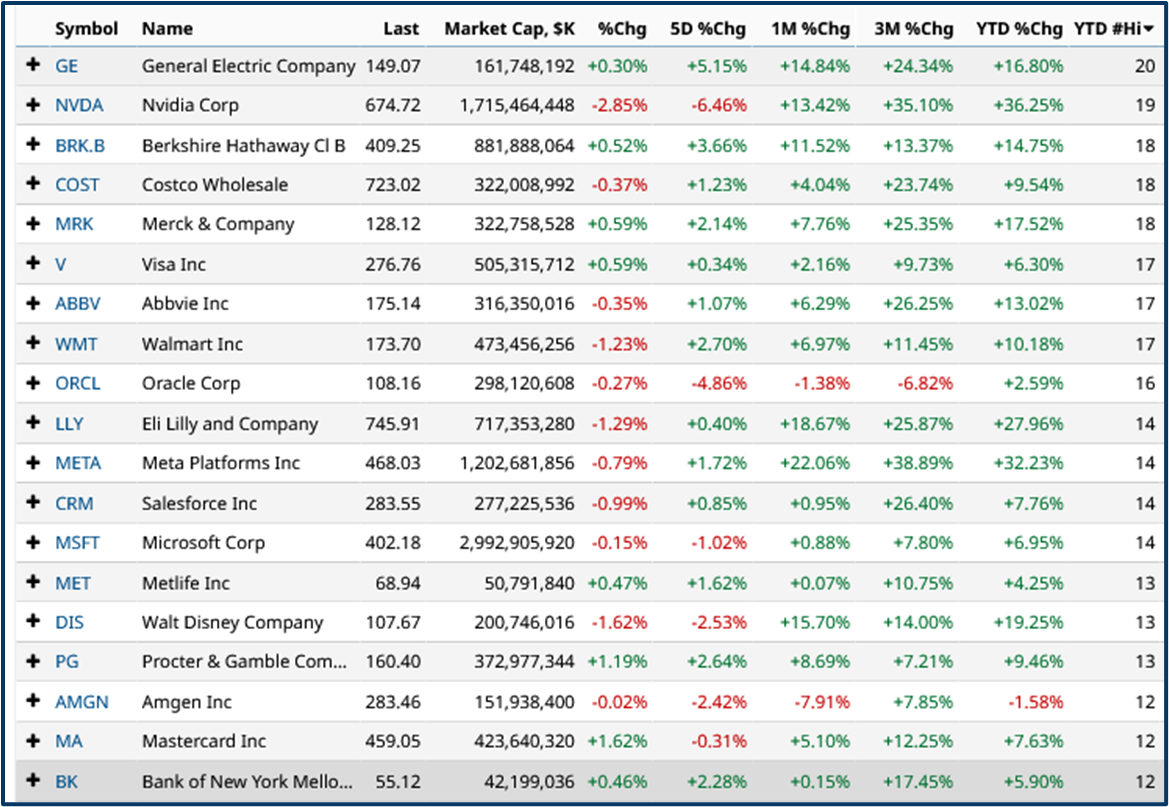
Here is a snap shot of a view, that I like to use to get an undertamnding of what’s happening in the market. The table contains the S&P 100 stocks and is ranked by the number of YTD new highs in descending order.
So for example GE (GE) has posted 20 new YTD highs since Jan 2nd, and has has moved +16.80% higher in that time. If we look across the table we can see that this momentum has and is continuing.
However on closer inspection we find that GE hasn’t been able to break above thje 5 year high price of $150.36 which could suggest that the uptrtend is coming to a close or at least is in need of an additional catalyst. Armed with that information we now have a level to watch in both directions.
As we might expect there is generally a positive correlation between the number of new highs in given period and the price action, in the underlying instrument. of course, there will be laggards, leaders and exceptions..
For example has Oracle (ORCL) posted 16 new YTD highs but is only up +2.59% this year while Amgen (AMGN) has posted 12 new YTD highs but is down over the last seven weeks. The charts of both of both stock could be worth exploring further on that basis alone.
S&P 100 stocks ranked by the number of YTD new highs descending
As is often the chart and tablets in this article have been created using freely available data and platforms in this case barchart.com.
In summary
New price highs and lows are essential price levels that traders should monitor closely.
These levels can provide valuable information about market trends, volatility, and sentiment, and can help traders to make better informed trading decisions to manage their risk effectively.
By incorporating new price highs and lows into their trading strategies, traders can better navigate the complexities of the markets and aim to position themselves for a greater chance of success.
The information provided does not constitute investment research. The material has not been prepared in accordance with the legal requirements designed to promote the independence of investment research and as such is to be considered to be a marketing communication.
All information has been prepared by ActivTrades (“AT”). The information does not contain a record of AT’s prices, or an offer of or solicitation for a transaction in any financial instrument. No representation or warranty is given as to the accuracy or completeness of this information.
Any material provided does not have regard to the specific investment objective and financial situation of any person who may receive it. Past performance is not a reliable indicator of future performance. AT provides an execution-only service. Consequently, any person acting on the information provided does so at their own risk.