
As I recently highlighted in the article Internal Flame despite the S&P 500 and other indices hitting new highs, there are plenty of signs that all is not happy in the broader markets.
That doesn't mean I have become bearish, far from it in fact.
However, traders must be pragmatic, not dogmatic.
So whilst I think the equity markets can still go higher, I am not wedded to the upside and I am mindful that things can turn on a sixpence.
That being the case I find myself spending more time and effort looking for short-term, tactical trading opportunities, rather than anything longer-term and strategic.
Finding tactical trading opportunities
To identify tactical opportunities I try to take a systematic approach, and that involves studying the price action and other indicators, looking for outliers, or things that stand out from the crowd.
To do that I have built some spreadsheets that track the performance of all S&P 500, FTSE 100 and Euro Stoxx 50 constituents.
Using these sheets I can screen for stocks that are showing strong or weak relative strength when compared to their peer group.
That's not relative strength in the form of RSI 14, but rather better than average price action.
For example, a stock that gaps down on the open, but then recovers to trade up on the day.
I find it easier to surface this type of price action visually, rather than combing through thousands of data points on the spreadsheet itself.
I created some charts to help me
Charts like this (see below) that I think of as my “Equity Smile”
Each bubble is an individual S&P 500 stock and its position on the chart says a lot about its price action and relative strength compared to its peers.
Stocks that are showing positive relative strength, in their price action, populate the RHS of the chart.
The strongest of these appear on the upper RHS.
Conversely, those stocks with weaker price action/relative strength populate the LHS of the chart, and the weakest of these the upper LHS.
The chart has dynamic pricing, which is near real-time, so it’s possible to see stocks transit from left to right, or right to left and, or rise or fall in the chart.
I am not watching this or other charts in the spreadsheet all the time, so I find it useful to take screenshots every so often, and then compare the latest shots to those taken earlier in the day.
Tracking Price Action /Relative Strength in the S&P 500 stocks
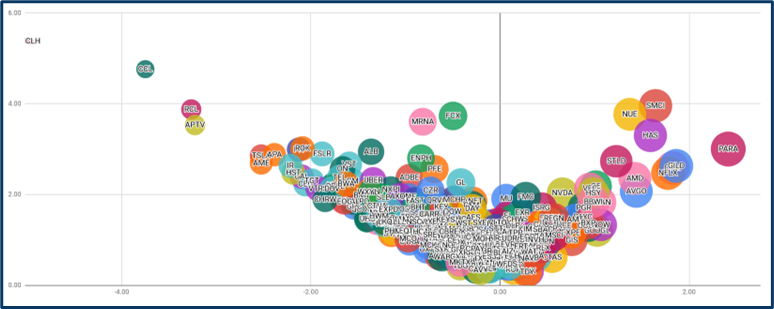
Source: Darren Sinden
Patterns and regular performers
Over time you start to notice patterns and tickers that keep cropping up, exhibiting repetitive behaviour, that warrants further investigation.
That’s the point at which it is worth looking at a price chart, where you can find points of interest and key levels, such as support and resistance, unfilled gaps and moving averages, trendlines etc.
Having identified points of interest and key price levels the next thing to do is to set an alert.
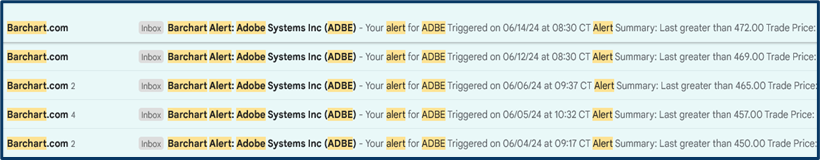
This is exactly what happened in Adobe ADBE US in the earlier part of June.
The price action suggested to me that they wanted to go better or move upward in other words.
So I set an alert, in fact, I set multiple alerts on rising prices and as you can see below, they were frequently triggered.
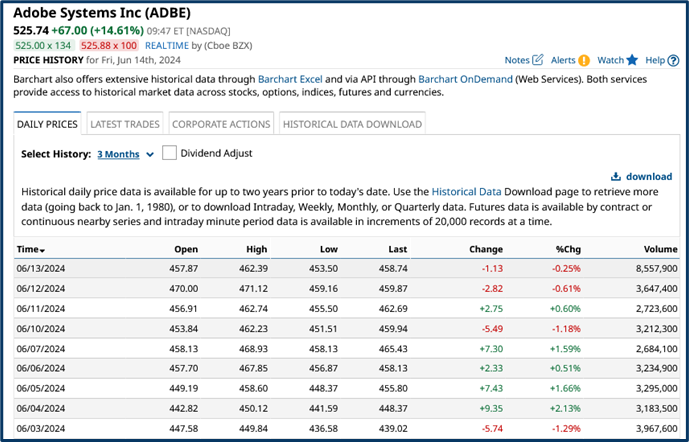
If we look at the high, low, open, close data for Adobe you can see what I am talking about.
There weren't huge gains, but we saw a string of upside days in the early part of June, and we only gave a portion of those gains back on intervening down days as well.
Another bullish signal in my opinion because it suggested that there wasn’t any concerted selling, or any major sellers in the mix at that point.
Source: Barchart.com
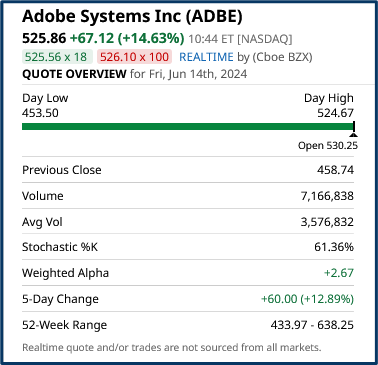
Adobe reported earnings after the close on June 13th and traded up by as much as +15.00% on Friday 14th following upbeat numbers and outlook.
The volume of stock traded was, well in excess, of the average daily volume for the shares as well, I note.
Source: Barchart.com
Another standout
Super Micro Computer SMCI US is another stock that regularly appears on my smile chart and once again it’s a stock that warrants, investigation and setting alerts for.
As you can see it triggered various alerts in both April and June, most recently the price rallied from $780.0 to $849.0.
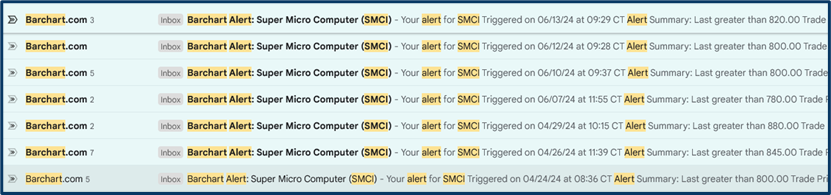
The gains in SMCI were more sporadic than those seen in ADBE, but once again we saw several up days ahead of a much more significant price spike.
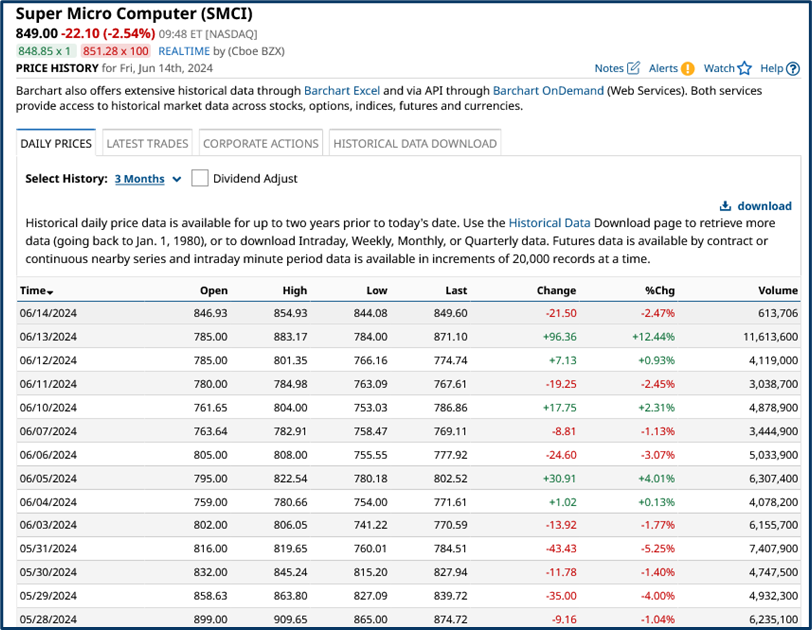
Source: Barchart.com
These are just two examples of stocks that stood out to me.
This tactical approach to trade selection is as much about creating a watch list of names and stocks of interest, as it is about finding something to trade right now.
By identifying price points of note on the candle charts and setting alerts around them, we are creating triggers to spark our interest down the tracks.
The more frequently those alerts are triggered, then, the more interesting that stock becomes.
And, as in the case of ADBE and SMCI, you may find that a catalyst appears to drive the price much higher over the course of a single trading day.
The information provided does not constitute investment research. The material has not been prepared in accordance with the legal requirements designed to promote the independence of investment research and as such is to be considered to be a marketing communication.
All information has been prepared by ActivTrades (“AT”). The information does not contain a record of AT’s prices, or an offer of or solicitation for a transaction in any financial instrument. No representation or warranty is given as to the accuracy or completeness of this information.
Any material provided does not have regard to the specific investment objective and financial situation of any person who may receive it. Past performance is not a reliable indicator of future performance. AT provides an execution-only service. Consequently, any person acting on the information provided does so at their own risk.