
In the first part of this article, we looked at whether top-down Macro themes, or bottom-up Micro themes, would be the driving narrative for equities across the rest of September 2025.
The article was written in the wake of the extraordinary moves in the price of Oracle ORCL US, which gave weight to the idea that it would be the “not so micro” bottom-up narratives that would win the day, so to speak.
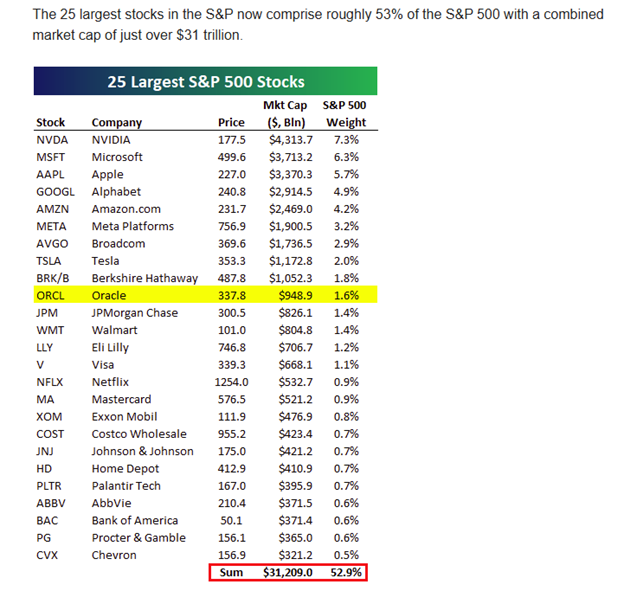
The quote and table below highlight what I mean.
“QUICK STAT ON ORCL FROM YDAY, Wednesday (10th Sept) saw Oracle’s market cap rise by more than $250 billion, which is a pretty impressive feat. That was just the 11th day in history to see a single stock tack on that much valuation, though the previous one came just a week earlier via Alphabet.
Put another way, Oracle added a little more than 0.8% of US GDP to its valuation on Wednesday. That is higher than we saw from any single name during the peak of the dot-com era in 1999-2000."
Source: Wells Fargo WFC US Sales Trading desk
The move in Oracle underlined the importance of the biggest companies to both the US & Global equity markets
Source: Bespoke Investment
We are back in a bull market, and the March lows have been left far behind
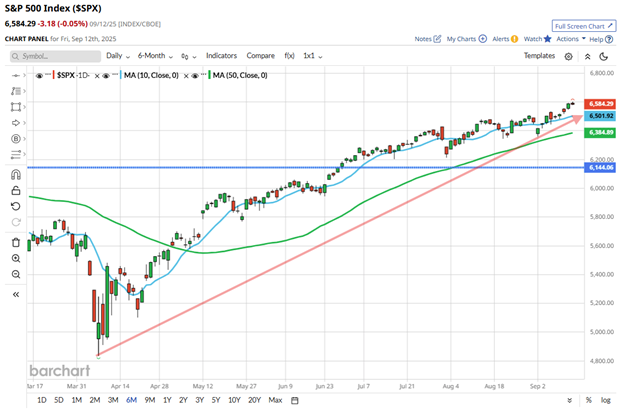
Source: Barchart.com
However, it's far from an even recovery as this table of S&P 500 Sector performance over the last 6 months shows.
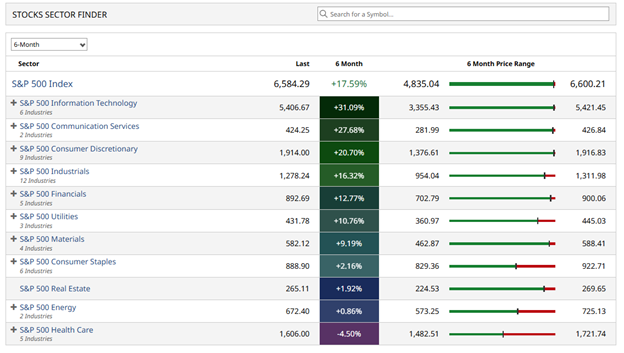
Source: Barchart.com
What’s more, the number of new 52-week highs among the majority of the S&P 500 stocks is declining (the blue line below) even as the S&P 500 index rallies.
A sure sign of narrowing index breadth/participation.
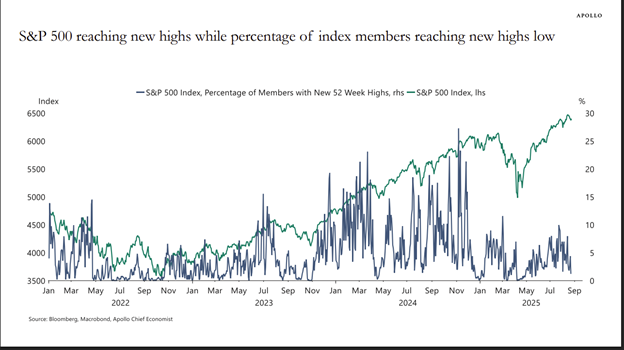
Source: Apollo Research
Concentrate
We can see how concentrated the S&P 500 index is becoming in the second chart from Apollo Management. I also note that the market capitalisation is rising ahead of, and diverging from, the earnings line, suggesting that expectations around US equities are becoming increasingly unrealistic.
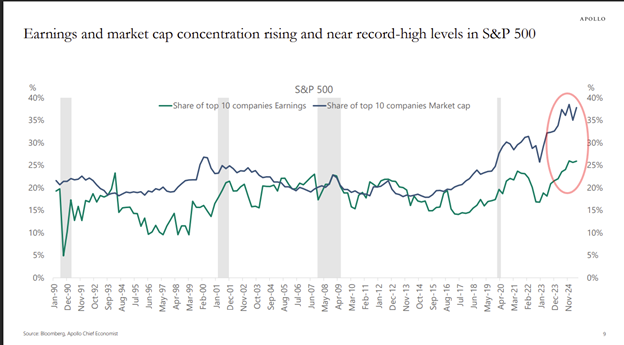
Source: Apollo Research
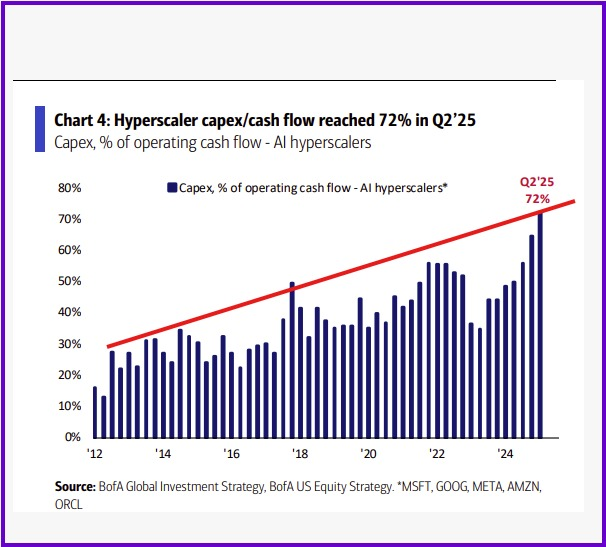
Nor are the so-called AI Hyperscalers immune indefinitely to a reality check
What we are looking at here is the ratio between capex and cash flow, literally the amount of money being spent and invested versus the amount of money being generated by the AI and cloud computing giants. The trend seems inexorable and continues to move higher and to the right. If the figure reaches 100% or higher, then these companies will need to choose between scaling back their investment or borrowing/ issuing debt to fund it.
The cash piles at tech companies were once seen as the wonder of the age, but these are quickly being eaten up by the demands of investment in AI infrastructure
Source: Bank of America
The cash piles at tech companies were once seen as the wonder of the age, yet these are quickly being eaten up by the demands of investment in AI infrastructure.
Profitability
The mention of money brings me to another point: Will AI become profitable? And just how will the likes of OpenAI meet their obligations to the cloud computing companies?
Consider these sound bites from the Eagle Point Capital substack:
“OpenAI signed a contract with Oracle to purchase $300 billion in computing power over roughly five
Years”
“The Oracle contract begins in 2027. Payments will begin at $30 billion per year and ramp to $90 billion per year in 2031 as Oracle brings capacity online. Payments will average $60 billion per year over the five-year contract.”
“OpenAI lost $5 billion in 2024 on $4 billion of revenue. They’re projected to lose upwards of $8 billion on $12 billion of revenue in 2025. $30 billion in 2027 (that’s) almost triple OpenAI’s current revenue. (And) They don’t expect to be profitable until 2029.”
Are we in a bubble?
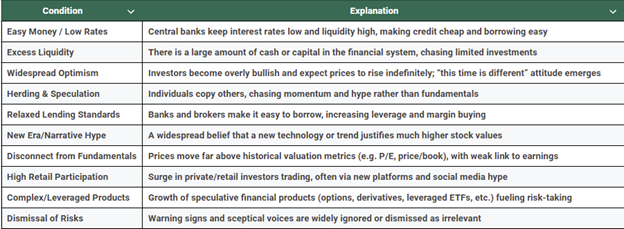
I asked Perplexity AI to describe the conditions under which a stock market bubble forms.
Here is its response:
“A stock market bubble forms when asset prices (such as equities) inflate far beyond their intrinsic value, driven primarily by exuberant market behaviour rather than underlying fundamentals
Several necessary conditions typically contribute to the emergence of a stock market bubble:
Source: Perplexity AI
“These conditions usually combine to push asset prices well above sustainable levels, setting the stage for a sharp correction when sentiment shifts or external shocks arrive.”
I then asked the AI to assess where US equities currently sat on a scale of 1 to 10, with one being the farthest away and 10 the closest to bubble conditions.
To which it responded:
“The current consensus of major analysts and market indicators places US equities at 8 or 9 out of 10 for bubble risk as of September 2025.”
Source: Perplexity Search
So, according to the AI, we are not yet definitively in a bubble, in US equities. However, we are getting close to that point.
And given the concentration, and dare I say reliance of the market, on the performance of just a handful of stocks. The market’s reaction,to the bursting of any bubble, could be very ugly indeed.
The information provided does not constitute investment research. The material has not been prepared in accordance with the legal requirements designed to promote the independence of investment research and as such is to be considered to be a marketing communication.
All information has been prepared by ActivTrades (“AT”). The information does not contain a record of AT’s prices, or an offer of or solicitation for a transaction in any financial instrument. No representation or warranty is given as to the accuracy or completeness of this information.
Any material provided does not have regard to the specific investment objective and financial situation of any person who may receive it. Past performance is not a reliable indicator of future performance. AT provides an execution-only service. Consequently, any person acting on the information provided does so at their own risk. Forecasts are not guarantees. Rates may change. Political risk is unpredictable. Central bank actions may vary. Platforms’ tools do not guarantee success.