
Just under a month ago I started an experiment in which I looked at whether rising volume could be used as an indicator and a way to highlight trading opportunities. I took a universe of S&P 100 stocks as my starting point. These being US stocks with the largest market caps and as such some of the most influential stocks in the world.
They are also some of the most widely researched and traded names and on that basis alone there shouldn’t be anything new that I could teach the market about them, should there?
As I said in the first part of this article
“Trading volume is a fundamental metric in the stock market, it represents the number of shares or contracts traded during a given period. Volume acts as a key indicator of market activity, liquidity, and investor sentiment combined.”
So could we, by screening the S&P 100 constituents for rising volume over two longer-term time frames, discover any predictive properties or add additional value to the process of identifying trading opportunities?
I outlined the process in the first part of the article so if you haven’t read it yet or are a bit unsure about what I did originally, it’s probably worthwhile having a read of that see the link above.
Almost one month on from my original screen of those 100 stocks it’s time to review our findings and they are very interesting too.
Here is a performance table containing the stocks that met my rising volume criteria, the table captures the returns over 5,10 and 20-day periods, as well as a 1-month time frame, which is the one that I am most interested in.
I have ranked the table by 1-month percentage change and highlighted that column in blue(gainers) or red (losers) as appropriate
One of the first things you may notice is that gainers outweighed losers both numerically and in terms of their performance.
There are two stocks that rallied by +20.0% or more of the last month, alongside another name that added +19.40% whilst another 4 stocks posted gains of +8.60% or higher.
S&P 100 stocks which exhibited rising volume over 6-months and 52 weeks as of 23-01-2025
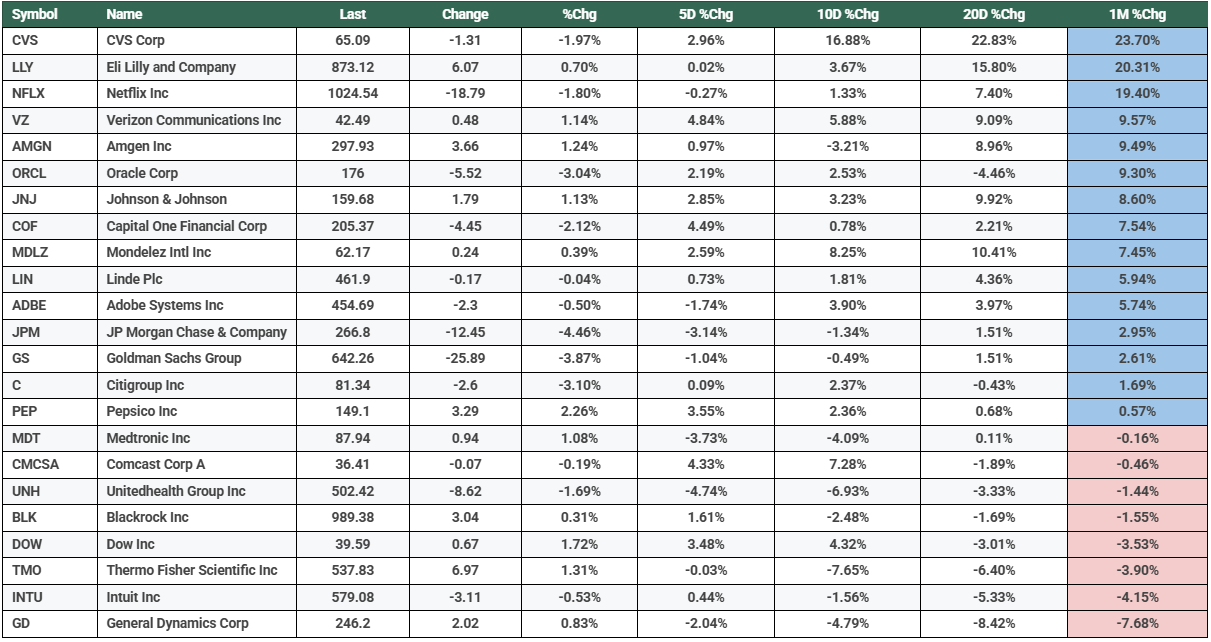
Source: Darren Sinden/Barchart.com
The outright performance of many of the stocks in the table above is impressive.
However it becomes even more so when you compare performance against the S&P 100 index itself which rose by just +0.70% in the period under observation.
The best performer in the rising volume list (CVS US) vs the S&P 100 index over one month

Source: Barchart.com
The average stock within my list posted a gain of +4.87% over one month as the close on 20-02-2025
There are 23 stocks in the list, and there are just 8 losers over the month. They lost an average of -2.86% this figures compared to a gain in the wider S&P 100 index of just +0.70% over the prior month.
We can also draw a comparison between the rising volume list and the average stock in the wider S&P 500. To do that I am using the equal weighted version of the index as proxy for the average stock.
The Equal Weight S&P 500 index is up by just +1.14% over the last month.
The Equal Weight S&P 500 index vs Verizon (VZ US)

Source: Barchart.com
My feeling is that we have shown that a persistent rise in trading volumes is a valid indicator in its own right, and one that can be used to identify actionable trading opportunities.
Now I should qualify that statement by saying that I conducted the experiment in the midst Q4 2024 earnings, so there may be an element of seasonality about the returns.
That said even if this becomes and indicator or tool, that can only be used effectively 4 times a year, if it can yield results like those highlighted above, then it will be very worth while exercise indeed.
What,s more this has been achieved using tools that are available for free.
And with that in mind I propose to run the screen again and create a new list of stocks once earnings season is out of the way and then monitor there performance over the following month.
The information provided does not constitute investment research. The material has not been prepared in accordance with the legal requirements designed to promote the independence of investment research and as such is to be considered to be a marketing communication.
All information has been prepared by ActivTrades (“AT”). The information does not contain a record of AT’s prices, or an offer of or solicitation for a transaction in any financial instrument. No representation or warranty is given as to the accuracy or completeness of this information.
Any material provided does not have regard to the specific investment objective and financial situation of any person who may receive it. Past performance is not a reliable indicator of future performance. AT provides an execution-only service. Consequently, any person acting on the information provided does so at their own risk.