
Trading volume is a fundamental metric in the stock market, it represents the number of shares or contracts traded during a given period. Volume acts as a key indicator of market activity, liquidity, and investor sentiment combined.
High trading volumes often coincide with increased interest or conviction in a stock, whether that’s driven by news, earnings, or broader market trends. And it’s not always on the upside, of course.
Conversely, low volumes may indicate indecision or reduced market participation.
Understanding what trading volumes are signalling, can provide valuable insights into market sentiment and potential price movements.
For investors, traders, and analysts, volume can reveal shifts in the supply and demand dynamics of a market, the strength of price trends, and even the likelihood of trend reversals.
For instance, a surge in volume during a price breakout may confirm the move's legitimacy, while declining volume might signal weakening momentum and a opportunity to fade that move
In this article I’ll look at the importance of trading volumes, exploring how they might be used to guide our trading decisions and enhance our market analysis. Which in turn should help us to understand what the market is telling us, and to anticipate regime or narrative changes and market moves.
Not just a second fiddle
Volume is often seen as playing second fiddle to price change, in the study of what's known as “price action”.
However, it shouldn't be, because the two metrics are intrinsic to the formation of “price action”, and the information that it can provide to traders.
I am a big believer in the idea that a move made with good volume is a far stronger move, than one that's been made without it.
Trading volume refers to the total number of shares or contracts traded in an instrument, within a specified period, such as a day, week, or month.
It represents the level of activity in a particular security or market, and it captures the amount of stock that is bought and sold, the frequency, or number of trades, and even the trade size.
Daily volume is the most commonly analyzed metric, but longer and or shorter time frames, can provide different perspectives on a share price's behaviour.
High volume often indicates heightened interest in a stock that may be driven by new information, be that news, earnings or corporate actions, such as share buybacks, or other market events.
There can be exceptions, however, for example during a short squeeze, we may encounter a vacuum or void in the market, during which the price of a security can gap up, as it tries to find a new equilibrium level.
At which point buyers and sellers are tempted back into the market, and can be matched against each other, which of course is essential for continuous, orderly trading.
We may also see a big price move without accompanying volume, if an unexpected takeover is announced.
Particularly if it’s made at a significant premium to the current share price of the target company.
However, there is likely to be plenty of volume traded, once that news has been digested by the market.
And in fact here is an example of just that situation:
The chart below is of H&E Equipment Service (HEES) which recently received an unexpected bid of $92.00 per share rom United Rentals (URI).
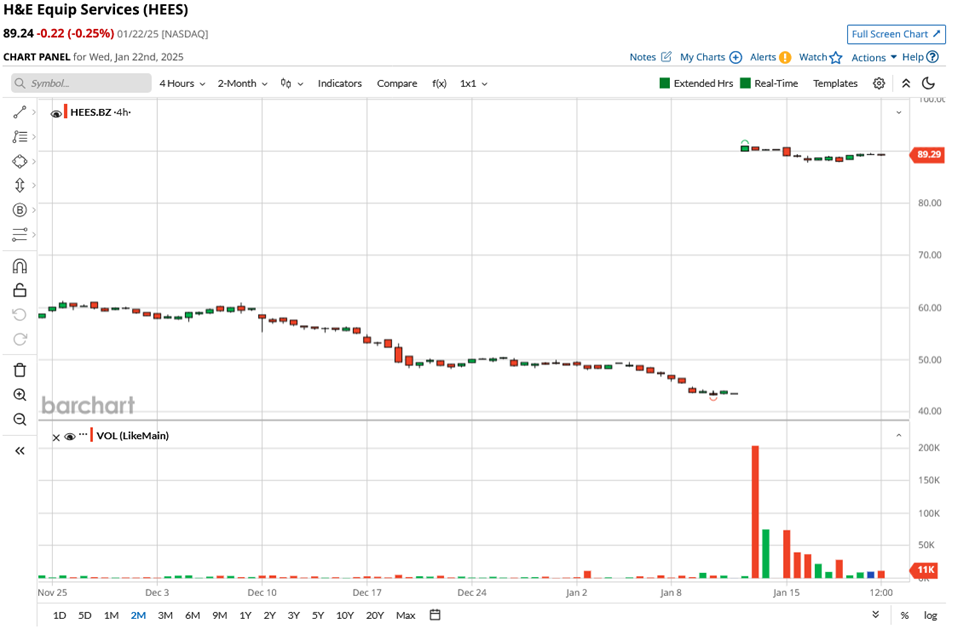
Source:Barchart.com
You can see that HEES price gaps from the mid $40s to $90.00 without any real volume being traded, and we then see the volume pick up (lower window) as traders catch up with what's happened.
Why Volume Matters
Volume is an important measure of market participation, which can reveal the intensity of buying and selling activity.
It can play a key role in confirming price trends or signaling potential reversals.
For example, when a stock’s price rises on high volume, it suggests strong buying interest and the likelihood of a sustainable trend.
Conversely, a price increase on low volume, may indicate weak conviction among investors, raising the probability of a trend reversal.
Additionally, volume can help identify key turning points in the market.
Spikes in trading activity often coincide with significant price moves, providing early clues about changes in sentiment.
By analyzing volume trends, traders can gain a deeper insight into the behavior and emotions of market participants, which in turn could help them make more informed trading decisions.
Can we use volume, and the trends within it, to identify trading opportunities?
As I have mentioned above, volume can act as a both signal and or a confirming indicator, about changes in the price action, including market dynamics and trader sentiment.
And it can be instrumental in identifying optimal trade entry and exit points.
Volume data can also provide us with an at a glance view of the market and the sentiment within it.
For example the graphic below contains a breakdown of the number of shares that have advanced or declined for both the NYSE or Nasdaq exchanges.
In a rising market we would expect to see a higher volume of advancing shares and a lower volume of declining shares. And that's exactly what we found for each exchange early in the session on Friday 24th January, when this snapshot was taken. (See the bottom left of each table)
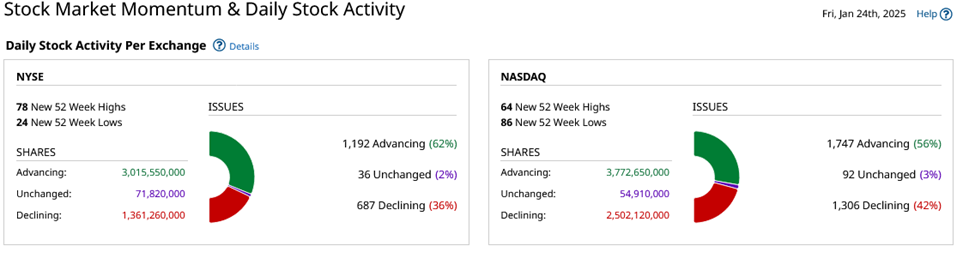
Source:Barchart.com
Could we use volume data to identify stocks, or characteristics within certain stocks, that create trading opportunities and setups?
I would say yes, in theory at least we should be able to do just that
To put this theory to the test I ran a screen on the S&P 100 stocks looking for those constituents which had demonstrated rising volume.
I.E. those that had a 1-month average volume, that was higher than both the 6-month and 52-week average volume in the name.
The results of that screen can be found in the chart below the blue columns represent 1-month average volume traded.
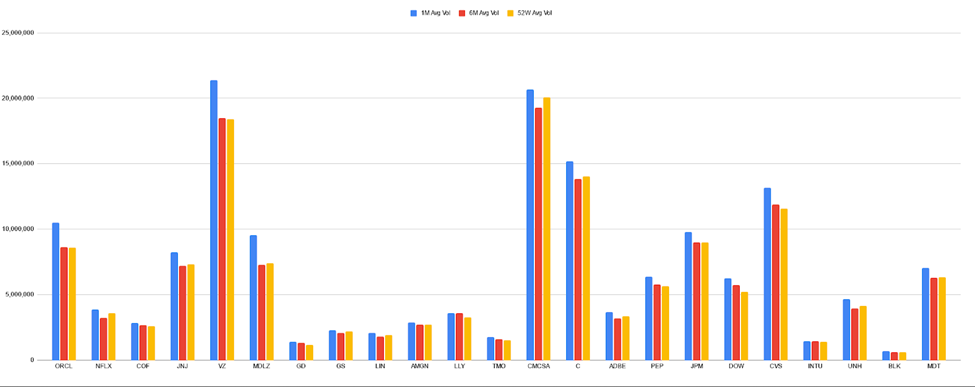
Source:Barchart.com Darren Sinden
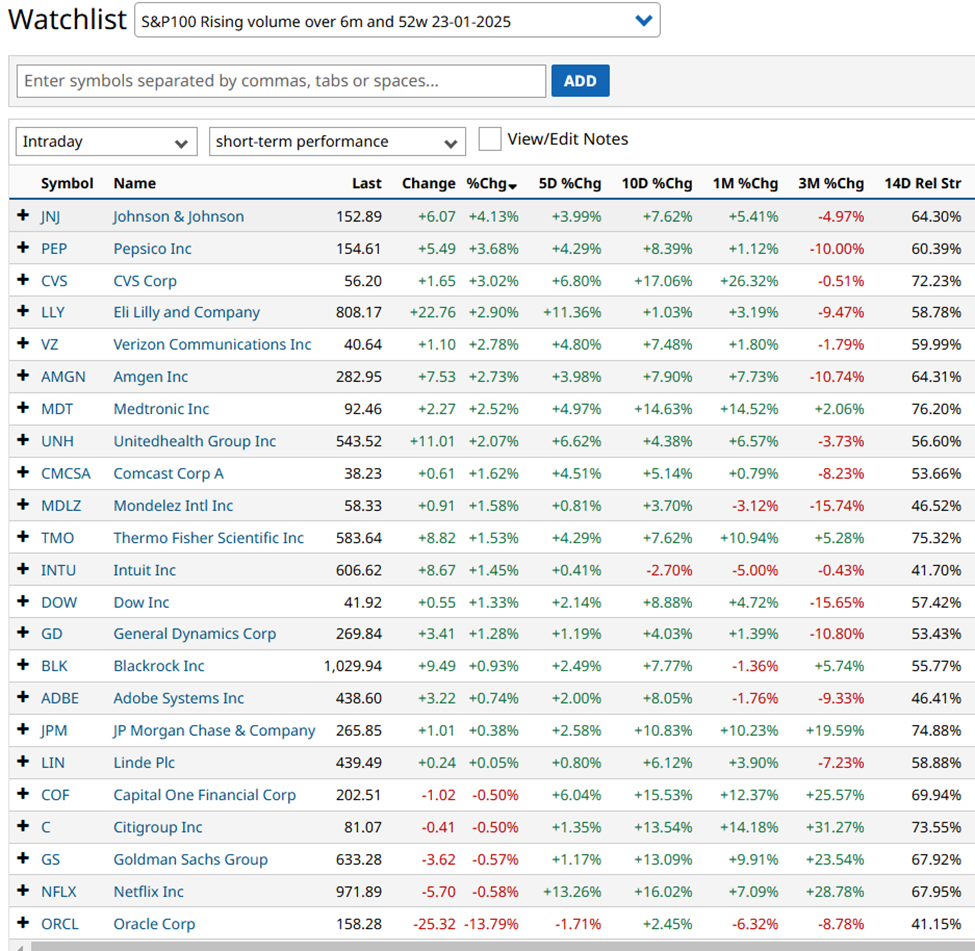
Here are those stocks, displayed in a watchlist which tracks their performance up to the close on Friday 24th January. I have ranked the list by 5-day % change.
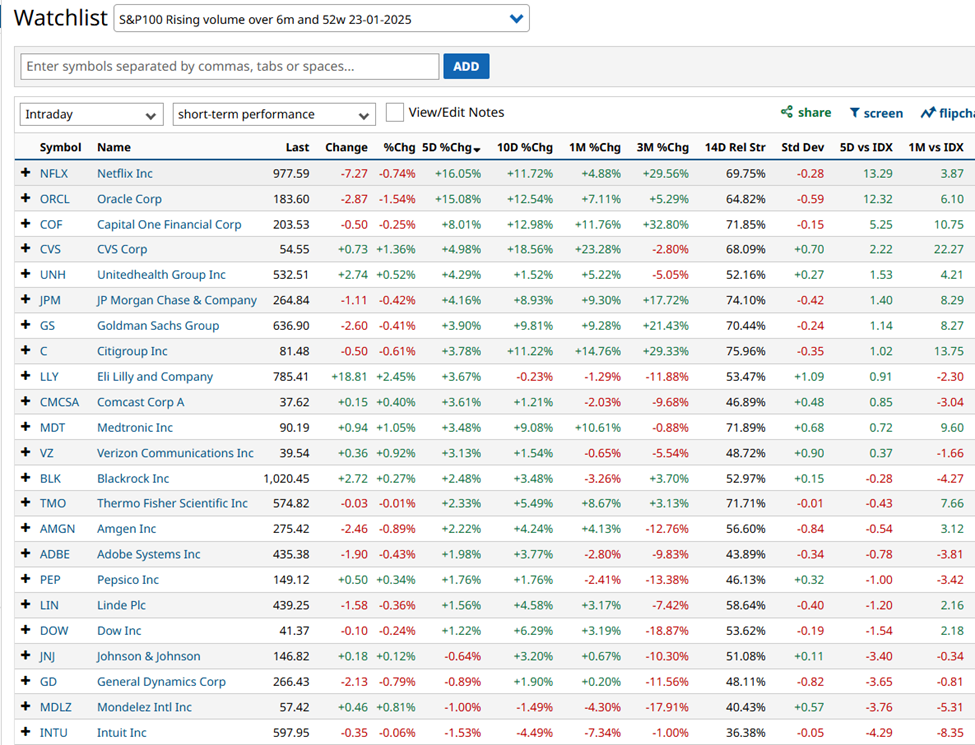
Source:Barchart.com
The expectation being that the stocks that met the volume criteria, might have an outsize upside performance. Of course that’s just a theory.
However, having the stocks in watch list with performance metrics will allow us to track whats happen to them and to determine if there was any validity to that line of thinking.
I will come back to this experiment in future articles and report on the progress good or bad.
In fact I can already report that something very interesting has already happened which is that the stocks in this rising volume watchlist dramatically outperformed the wider market in Mondays technology and AI sell-off and only Oracle ORCL experienced a significant fall in its sharprice
Performance until the close on 27/01/2025 ranked by daily % change descending
Source:Barchart.com
This performance becomes all the more interesting when you realise that the S&P 500 index fell by -1.46% in Monday’s trade and the S&P 100 by -1.68%.
The information provided does not constitute investment research. The material has not been prepared in accordance with the legal requirements designed to promote the independence of investment research and as such is to be considered to be a marketing communication.
All information has been prepared by ActivTrades (“AT”). The information does not contain a record of AT’s prices, or an offer of or solicitation for a transaction in any financial instrument. No representation or warranty is given as to the accuracy or completeness of this information.
Any material provided does not have regard to the specific investment objective and financial situation of any person who may receive it. Past performance is not a reliable indicator of future performance. AT provides an execution-only service. Consequently, any person acting on the information provided does so at their own risk.