I am returning to the topic of momentum because in some senses it's what trading is all about, in the markets prices move because of changes in supply and demand, available information, and trader sentiment.
Momentum whether upward or downward is an expression scale of those changes.
Think of momentum as an indicator that tells us how persistent changes in supply and demand, available information and or sentiment are.
Simply put the more persistent the change, then, the more momentum the price action has.
Favoured Trades
As traders, we want to be able to identify trading opportunities that have the potential for significant momentum. We can't easily quantify how much potential there is within a trading opportunity, but we can make an informed guess or estimate.
Estimating how much momentum there could be in trading opportunity is part of the process that I call “What if Thinking” under which we stop trying to discover why something should or shouldn't happen and instead focus on what could happen if it did.
In essence, we are trying to work out why the market should favour our trade over thousands of other potential trades that are available at any given time.
Finding those favoured trades, trades that are full of possibilities (potential momentum) and being able to do so consistently is a recipe for success.
However, picking out trading opportunities from the oceans of information and possible trades that confront us daily is no mean feat. And to stand any chance of doing this we need to think, work smarter and systemise.
Working Smarter
“Thinking and working smarter” means letting the market tell us where the opportunities lie.
We can use indicators and measures of relative performance to do just that and it needn't be overly complicated.
Let's take a well-known and widely used indicator, the RSI 14, as an example.
RSI 14 shows traders how a stock or other instrument is currently trading, relative to history, usually 14 previous trading periods. However, that figure can be adjusted.
The indicator expresses the current relative performance as a percentage, in a range between 0% and 100%.
Built-in boundaries
The indicator has overbought and oversold boundaries located at 70.0% and 30.0%.
And though they are not buying or selling signals in their own right, RSI 14 says a good deal about recent price action, momentum and what may come next.
One way to use RSI 14 is to look for overbought stocks, that have an RSI 14 reading of 70.0% or greater. Or for those stocks that are oversold and which have an RSI 14 reading of 30.0% or less.
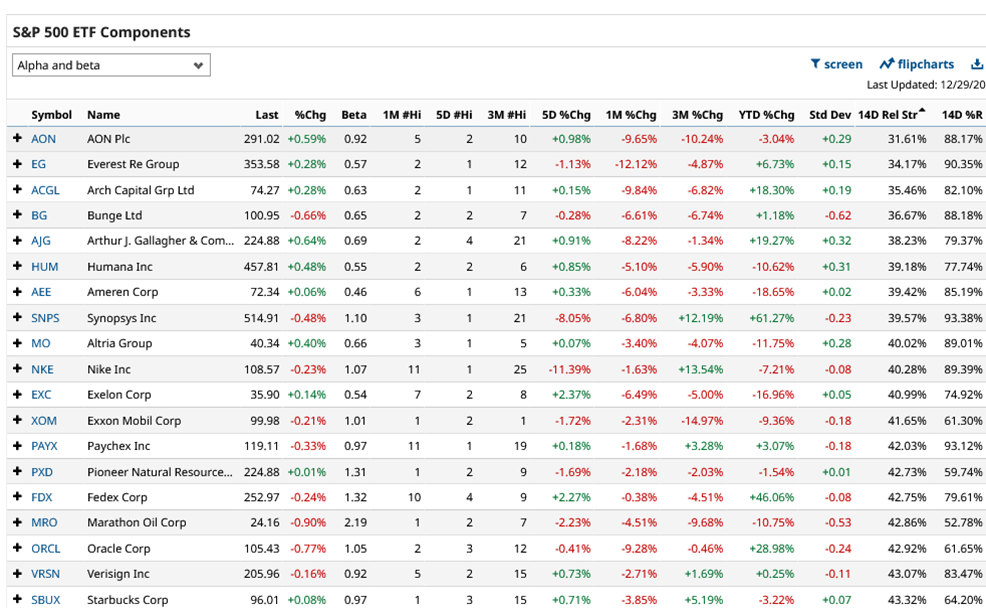
In the table below I have selected the S&P 500 stocks and ranked them by their RSI 14 reading, lowest to highest.
In this instance, there are no stocks, within the index, that have an RSI 14 reading below 30 though insurers AON (AON) and Everest Re (EG) both have readings in the low 30s and thus well below the 61.66% average RSI 14 for all S&P 500 constituents.
What’s more the S&P 500 financial sector is up by +13.44% in the last quarter whilst AON has fallen by almost -10.25% over that period.
There is no guarantee of course, that AON, or any other stock, with a low RSI 14 reading and poor relative price performance, will rally. However, highlighting these factors can show us the recovery potential contained within stocks like these, if they do start to perk up.
Select S&P 500 stocks ranked by RSI 14 readings

Source Barchart.com
Real-world example
In the article A Note on Momentum I used a similar method to identify and highlight medical equipment maker Illumina (ILMN).
At that time, they were trading around $117.00, having rallied from $90.00 in the previous couple of weeks, though the stock had fallen from $210.00 since the summer.
Illumina went on to post a golden cross (a sign of rising price momentum) with the 10-day MA line moving up through the 50-day MA Line, the Illumina share price printed up at $143.94 on December 21st.
The takeaway from this is that opportunities can play out over a variety of timescales and that in its purest sense, momentum is a measure of the likelihood that a stock or other instrument will continue to move in its current direction of travel.
Turning points in momentum are often where trends start or finish, and that’s always worth being aware of.
The information provided does not constitute investment research. The material has not been prepared in accordance with the legal requirements designed to promote the independence of investment research and as such is to be considered to be a marketing communication.
All information has been prepared by ActivTrades (“AT”). The information does not contain a record of AT’s prices, or an offer of or solicitation for a transaction in any financial instrument. No representation or warranty is given as to the accuracy or completeness of this information.
Any material provided does not have regard to the specific investment objective and financial situation of any person who may receive it. Past performance is not a reliable indicator of future performance. AT provides an execution-only service. Consequently, any person acting on the information provided does so at their own risk.