
I though it might be interesting to drill down into the Energy/Oil sector and see if we can find any reasons for optimism or any short-term trading opportunities.
Crude oil has been under pressure over the last month, during which WTI has fallen by -15.67% and Brent crude by -13.92%. As of the time of writing.
If we look along the futures curve. In this case futures over WTI, we can see that the negativity around oil prices extends across multiple time frames, and at least 12 months out into the future.
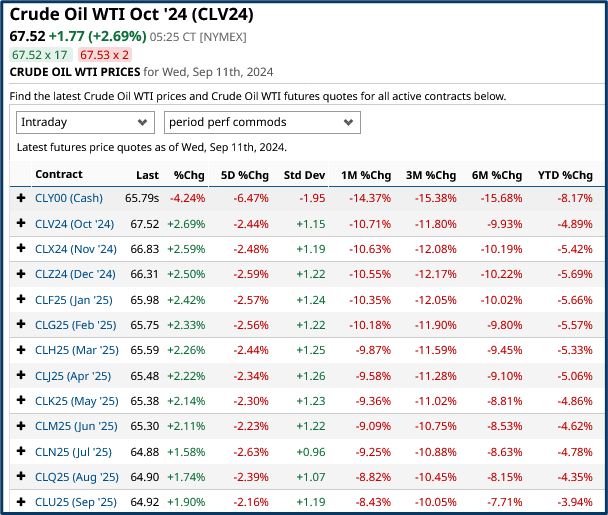
Source: Barchart.com
However it’s notable that oil prices have started to tick up, on the daily time frame, in the snapshot above.
We will come back to this point a little later on.
What about the energy stocks themselves? How have they been faring?
Looking at the S&P 500 energy sector components most of them have had a torrid time of it .
And there are only a handful of year to date gainers remaining in the list below.
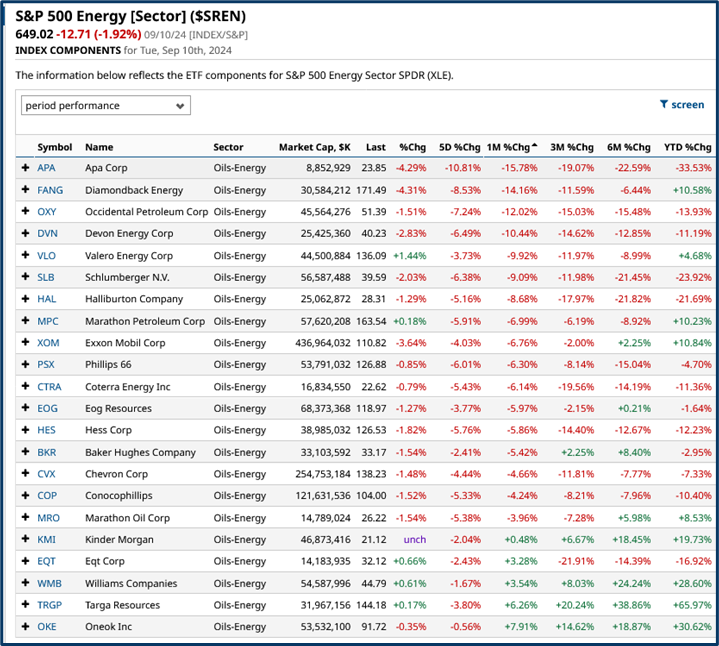
Source: Barchart.com
The RSI 14 reading for the S&P 500 Energy sector is 31.89 as of the close on September 11th.
Over the last 2-years we have rarely seen it lower, and when it did dip below these levels, the index rallied see March 2023 in te chart below for example.
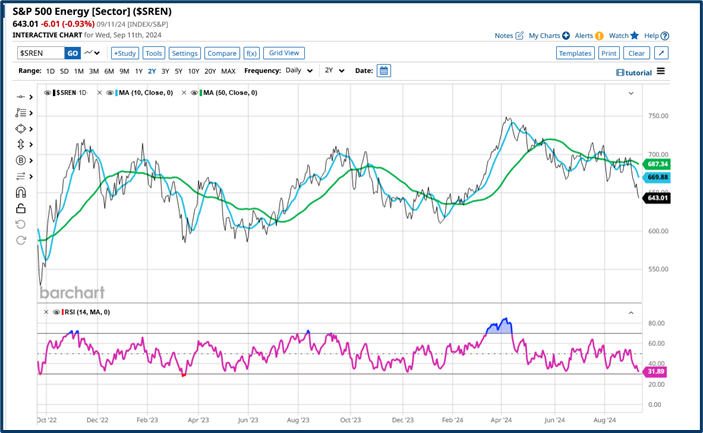
Source: Barchart.com
Looking at the list of stocks in the Energy sector.
We find that 16 out of the 22 constituents have an RSI 14 reading below 35. See the table below.
Beta is a measure of a stock's sensitivity to a move in the underlying index ,of which it is a member. And I have included the 1-month % change, to provide some short term context to the price action.
Readings in red indicate and oversold level on the RSI 14 indicator
S&P 500 Energy stocks with an RSI14 of less than 35.00
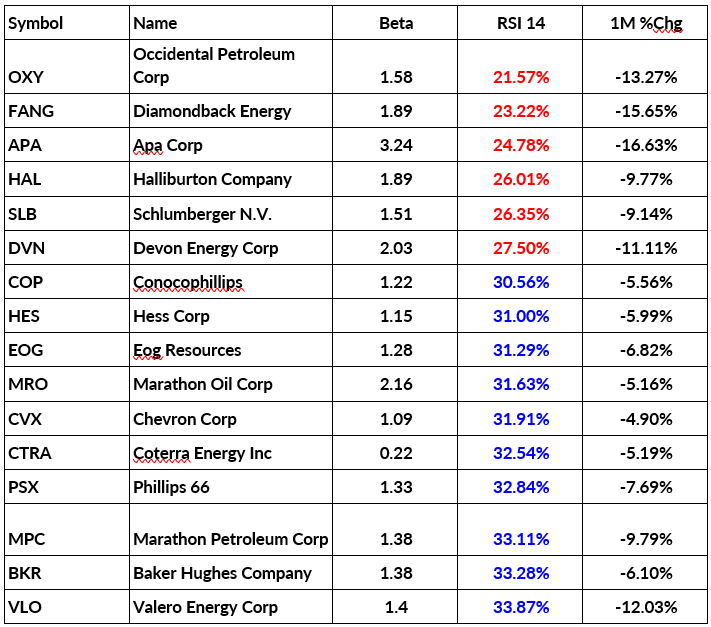
Source: Barchart.com
Momentum and Sentiment
As you may recall I like to track momentum and sentiment using MA percentages.
That is the percentage of stocks in an industry, sector or index, that are trading above key moving averages.
The chart below plots the percentage of S&P 500 Energy stocks that are trading above their respective 50-day MA lines, drawn in black. That figure is currently reads just 13.63%.
I have also added the spot price of WTI crude to the chart, in green.
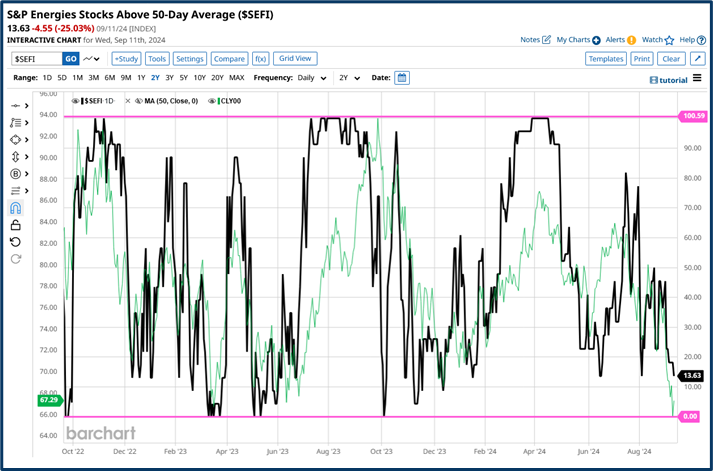
Source: Barchart.com
What immediately strikes me is how closely correlated the two lines are.
And what that says to me, is that they can act as proxies or indicators for each other.
The MA percentage line can fall further still, but over the last two years, when it has reached, or come close to zero, it has bounced, and that bounce has often coincided with a rally in oil prices.
Our final chart is the weekly plot of WTI and Brent crudes, during which they been ticking higher.
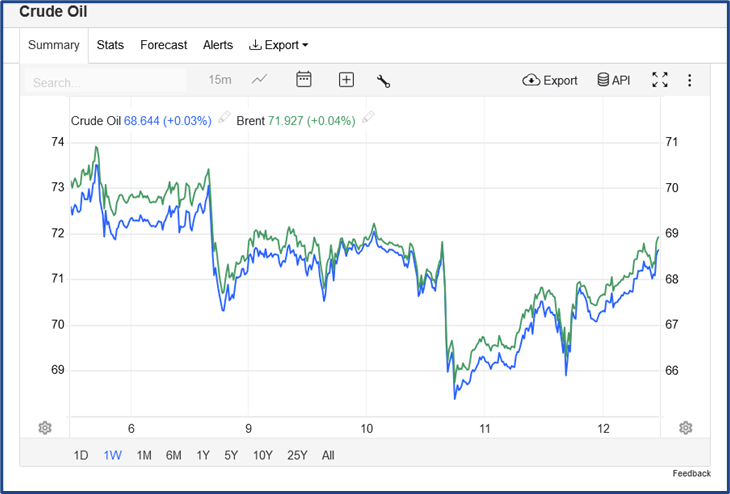
Now of course a slight uptick does not constitute a full scale bounce, or recovery for oil.
For that to happen we would need a positive catalyst around global growth, or more likely some kind of supply side constraint.
There is nothing obvious on the horizon, but as they say in the British army “failing to prepare is preparing to fail”
There have also been a couple of positive comments from brokers on oil, including this one from Morgan Stanley.
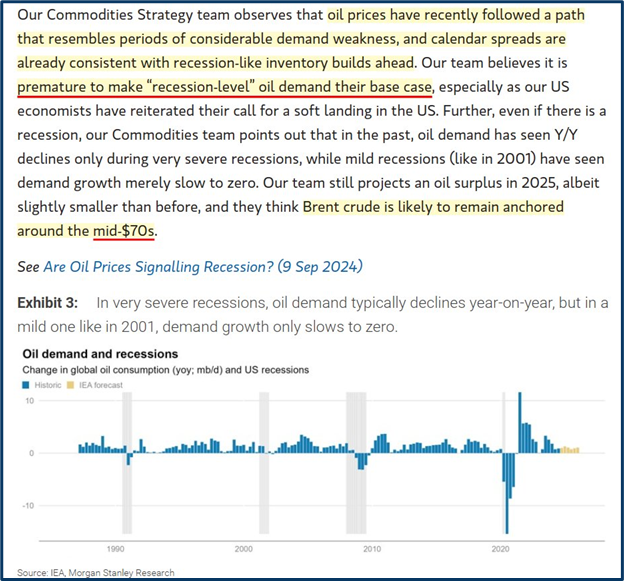
Source: Morgan Stanley Research
Whilst Bank of America’s quant team highlights the underperformance/upside potential in the S&P Energy sector in the table below.
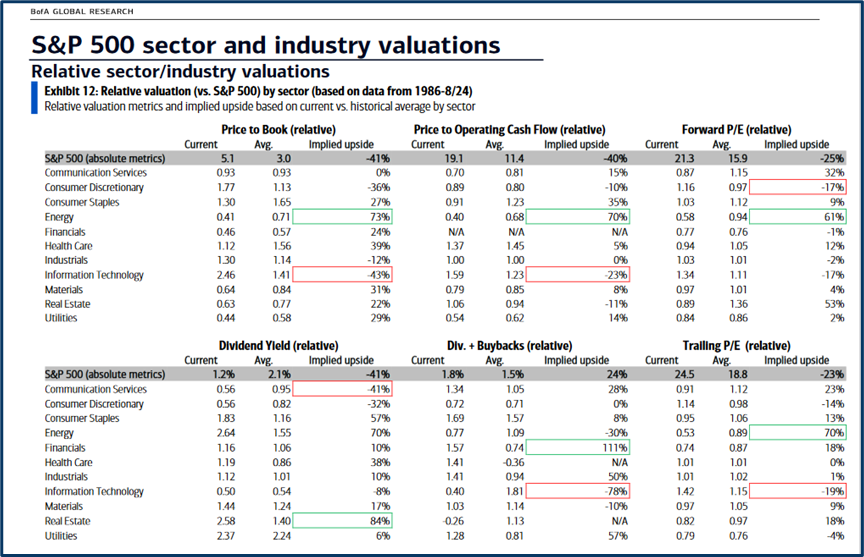
Source: BofA Research
The information provided does not constitute investment research. The material has not been prepared in accordance with the legal requirements designed to promote the independence of investment research and as such is to be considered to be a marketing communication.
All information has been prepared by ActivTrades (“AT”). The information does not contain a record of AT’s prices, or an offer of or solicitation for a transaction in any financial instrument. No representation or warranty is given as to the accuracy or completeness of this information.
Any material provided does not have regard to the specific investment objective and financial situation of any person who may receive it. Past performance is not a reliable indicator of future performance. AT provides an execution-only service. Consequently, any person acting on the information provided does so at their own risk.