
One of the trading strategies that’s most popular with retail traders, is following the crowd,these days that often involves listening to, and reading, what people are saying on social media, checking out the trending stocks on Reddit, Stocktwits, Seeking Alpha and alike.
And then, jumping into trade that's popular in those forums.
And, with any luck, the weight of numbers will be in your favour, and you will see a profit on the trade,before moving on to whatever’s the flavour of the day tomorrow, or next week.
Of course, you still need to be watchful,l and make sure that you are not the last one to the party.
Because deep down, these crowded trades often rely on the greater fool theory for their success.
In plain English, that is “someone else to buy the stock” after you.
And if the supply of buyers (fools?) dries up, then the price of that stock is likely to stop rising, and could quickly go into reverse.
Here is a good example of what I am talking about in Quantum Computing start-up Ionq IONQ US.
The high (small red arrow) denotes the point at which the supply of new buyers dries up.
After that, the stock price falls sharply (large red arrow)
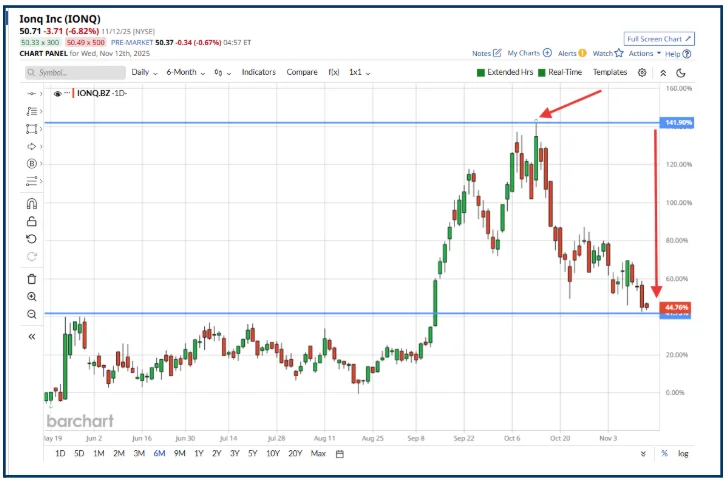
Source:Barchart.com
On the contrary
An alternative to that crowd following strategy is to be a contrarian, a trader who looks at unloved stocks, and trades that are the opposite of what the social media pundits and their followers are saying.
If you are an institution, have deep pockets and long term time horizons, this could be a very lucrative approach indeed.
Professional money manager Peter Lynch used a contrarian appropach to generate annualised returns of +29.0% per annum, during his 13-year stint managing the Fidelity Magellan Fund.
Effectively doubling the returns seen in the S&P 500, over that period.
Now of course markets have transformed dramatically since those days, and value investing has lost its sheen for many, in an age of meme stocks, and the pursuit of growth at all costs.
Despite that, it’s still possible for retail clients to be contrarian traders, because of what’s contained in this chart..
The Market Cycle
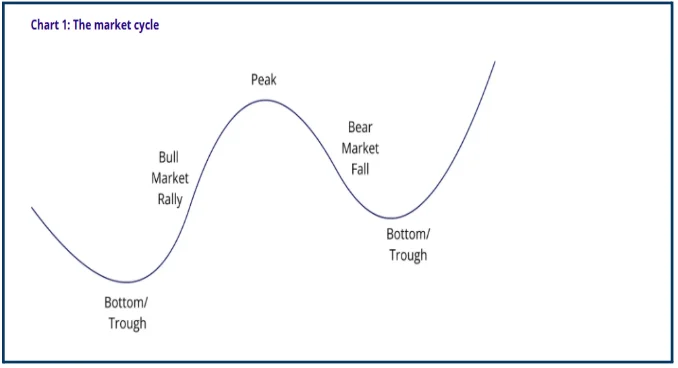
Source: Vaneck
The chart above illustrates the cyclicality in the markets
Cyclicality is effectively the swing in trader sentiment from bullish to bearish, and back again.
In many ways it is the life blood of the markets, as stocks and sectors move in and out fashion, money moves with them.
Traders become bullish of stocks that are being bought and bearish of those that are being sold.
Of course those stocks might well have been bought and sold for good reasons; such as changes in their fundamentals, new information about, and new narratives around the stock or sector.
Or even shifts in macro data, and themes.
The two dominant forces in trading are greed and fear
They are dominant in trading because they are dominant in the psyche of human beings.
Both emotions are prone to over extension however.
That means that stock prices often get hit too hard, or pushed up too high by the market.
Contrarian trading seeks to take advantage of these over extensions in price.
In the expectation that the market will eventually realise its mistakes. And that, the prices of stocks that have overextended, will correct and move back in line with their peer groups.
Skiing up hill
The Luxury Goods sector has had a mixed 2025.
As of the end October the MSCI Europe Textiles, Apparel and Luxury Goods Index, was up by just +9.09% year to date.
That compares to a +43.0% gain in the Spanish Ibex, a +35.0% gain in the Hong Kong 50 and +70.95% Year to date gain, in the Euro Stoxx Banks index.
This table below shows the performance of the Textiles, Apparel and Luxury Goods index ,all the way back to 2011.
I have highlighted some of the bigger moves, in both directions, to provide some context
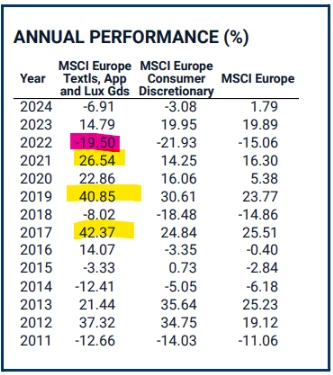
Source:MSCI
One of the stocks in the European Luxury Goods sector is Moncler Spa MONC. The company makes up-scale ski and leisure wear.
Ski jackets that can cost £3000.00 are undoubtedly a discretionary purchase for most people, particularly in the midst of a cost of living crisis.
However Moncler’s clientele are rich, and as author FS Scott Fitzgerald famously said:
“Let me tell you about the very rich. They are different from you and me.”
To some extent that means that the demand for Moncler’s products is inelastic, or if you prefer it’s not price sensitive.
Now, fears about the global economy, the US China trade spat and associated tariffs, all helped to push Moncler’s share price down by around -20.0%, from its mid-May peak of €58.923.
Indeed by mid August they were trading below €46.00 a share.
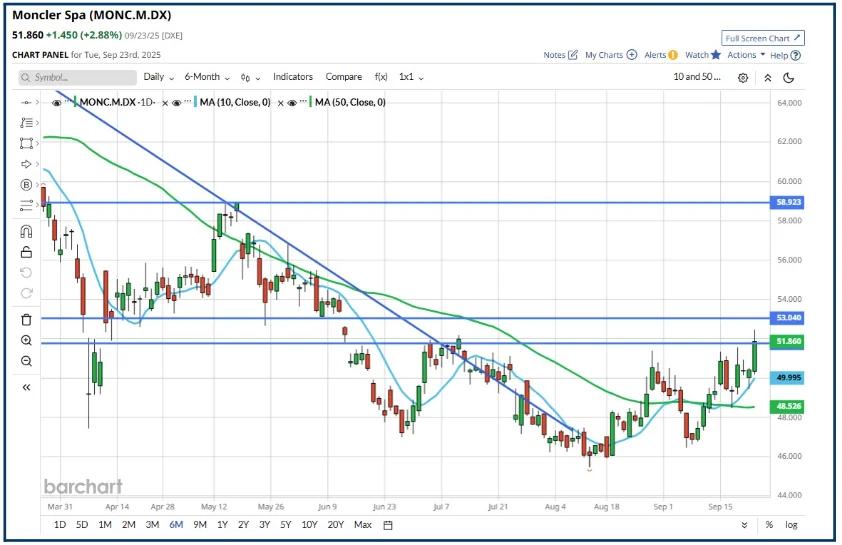
Source:Barchart.com
However, during that time, rival luxury coat maker, Canada Goose, received a bid, from Private Equity firm Bain Capital, an existing and major shareholder in the Canadian business.
Bain Capital were not the only fund to consider bidding for Canada Goose, according to reports from Reuters.
There was still interest in owning high-end clothing and accessory brands
That didn't mean Moncler were necessarily a takeover target themselves.
But, it did suggest that the sell off was over done, and that there was a catalyst for recovery in the sector and stock price.
I kept a close eye on Moncler stock, after the Canada Goose news broke.
However, it wasn’t until a month later on September 23rd that I bought the opportunity to the attention of the professional traders, I speak to on a daily basis.
Saying that: “Moncler was one to watch closely from here” sharing the chart above, as I did so.
What next?
The chart below shows what happened to the Moncler stock price after that.
The vertical, dashed, green line indicates where I highlighted the stock.
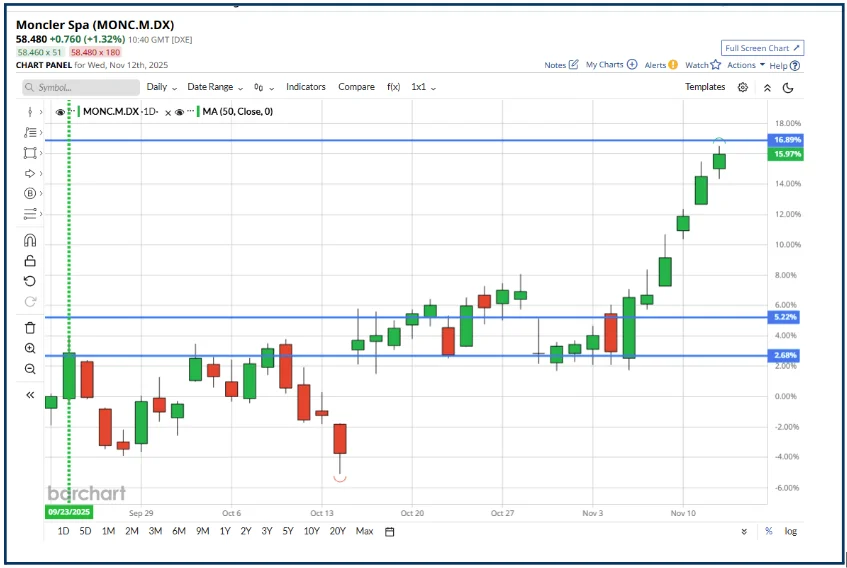
Source:Barchart.com
It wasn’t straight line recovery by any means
Indeed Moncler traded lower in Mid October.
However, at the end of the month, Presidents Trump and XI met in South Korea, and agreed to defer any additional tariffs, for 1-year, whilst trade negotiations continued.
Market sentiment turned positive, and a few days later, the Moncler stock price “took off” and rallied by as much as +14.0%.
Not every contrarian trade idea will work as well as this.
However, if you learn to recognise when stocks and sectors are oversold or overbought, and have an understanding about the catalysts, that might start a correction or re-rating, then you should be able to take a contrarian view, and trade away from the crowd, even if it's only from time to time.
The information provided does not constitute investment research. The material has not been prepared in accordance with the legal requirements designed to promote the independence of investment research and as such is to be considered to be a marketing communication.
All information has been prepared by ActivTrades (“AT”). The information does not contain a record of AT’s prices, or an offer of or solicitation for a transaction in any financial instrument. No representation or warranty is given as to the accuracy or completeness of this information.
Any material provided does not have regard to the specific investment objective and financial situation of any person who may receive it. Past performance is not a reliable indicator of future performance. AT provides an execution-only service. Consequently, any person acting on the information provided does so at their own risk. Forecasts are not guarantees. Rates may change. Political risk is unpredictable. Central bank actions may vary. Platforms’ tools do not guarantee success.