Is it possible to successfully trade news and events, as they happen?
I have said it before and I will no doubt say it again: “Traders need to be adaptable, if they are to succeed”
They need to adapt to changing market conditions, changes in narratives and sentiment, and be able to trade multiple products over various time frames.
Part of that adaptability, is being able to react to events in real time, and in particular developments in news flow and price action.
Trading events and news as they happen, might seem very different from looking for, and assessing trade set-ups and chart patterns. And then, waiting for a catalyst to set the wheels in motion.
However in reality, it’s very similar to the final stages of that process.
Or if you prefer it’s a truncated version of it. Under which the trader is fast forwarded to the final stage of the process - the appearance of a catalyst, and the subsequent reaction in the price of the instrument.
Let me show you what I mean using some recent real world examples
In the first instance I’ll look at short term momentum/sentiment .
US equities currently have both a pre and post-market session.
The pre market in particular allows us to gauge sentiment towards stocks and sectors ahead of the regular session.
Pre and post-market trading is not as liquid as the main session, but there can still be decent volumes traded and significant moves in stock prices.
Let’s examine how that can be used to our advantage.
Quantum leap
The stock market is subject to the whims of fashion, just as much as the catwalk and the media are.
Which means, that certain stocks, and groups of stocks, are in vogue, with traders and investors, at any given point .
Right now the height of fashion includes stocks in quantum computing, AI, data centres and nuclear power.
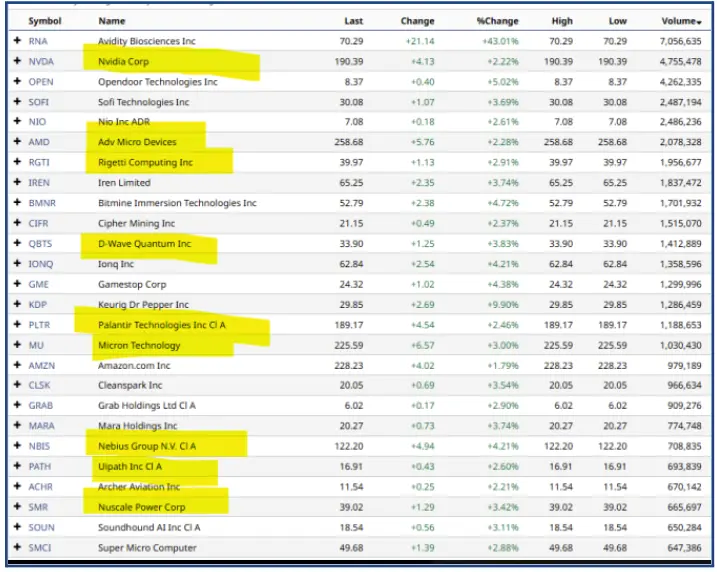
The table below shows stocks that were making gains in the pre-market, on Monday 27th October.
The table is ranked by the volume traded in those names, during pre-market trading.
The reason I have done that, is that price changes, accompanied by good volume, are generally more believable/sustainable, than those that occur without it.
I produced this table, about 15 minutes before the opening of the regular session on Monday.
And I highlighted names within it, that I felt had the ability to move higher in the regular session, and, or were good indicators of sentiment or the mood of the market.
Stocks in that later category included Nvidia, NVDA , Plantir, PLTR and Advanced Micro Devices ADM.
Stocks that I felt could move higher in the regular session, included D-Wave QBTS, Rigetti Computing RGTI, Nebius NBIS, and Nuscale Power SMR.
The reason I believed that these stocks could make bigger moves, is that they have all demonstrated that ability in the recent past.

Source: Barchart.com, Darren Sinden
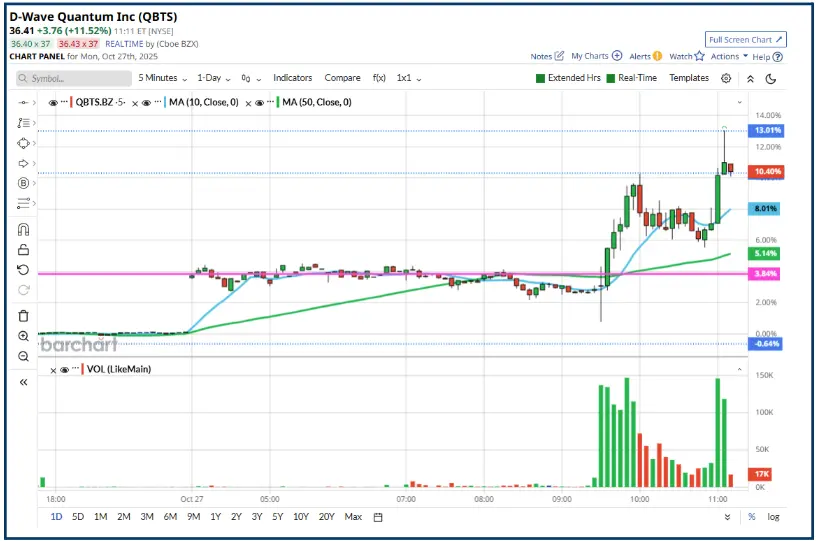
At the time I generated the table, and ranked and highlighted stocks within it, D-Wave was trading up by +3.83%, as illustrated by the horizontal magenta line on the chart below.
This chart is a 1-day plot, with 5-minute candles, that is each candle on the chart represent 5-minutes of trading time.

Source: Barchart.com
The regular session starts at 9.30 am in NewYork, which corresponds with the appearance of the first bold, green (bullish) candle on the chart (see the RHS above).
The candle is rising, indicating that higher highs are being posted.
That suggests to me that there was a good chance that the price could continue to appreciate.
Which is exactly what happened: the stock posted 4 more bullish candles, taking its gains to +10.40% before pulling back.
That process took 25 minutes, that’s plenty of time to make an assessment about the price action,open a position, and if proven correct, to make a profit.
Later on, QBTS spiked once more, to briefly print at up +13.01% on the day.
The key takeaways here are that the pre-market move was confirmed on the opening of the regular session, and that the high price, posted in the opening 5 minutes, was taken out in the next five minute period, and so on.
Higher highs are a key component of an uptrend after all.
What about trading news flow and announcements
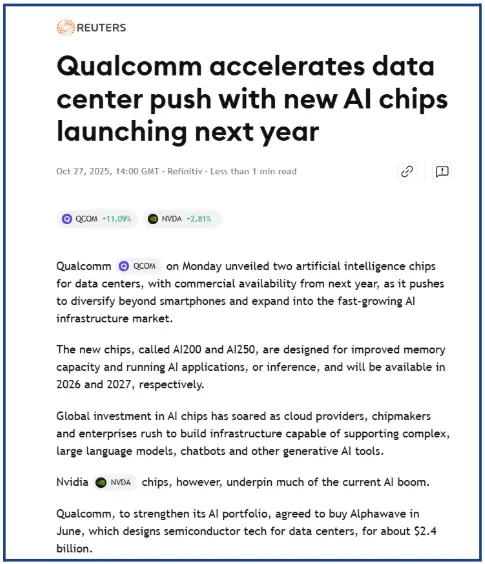
There was an opportunity to do just that in Monday's US session as well. Thanks to chip maker Qualcomm QCOM, which announced the launch of new range of AI chips, to be released in 2026.

Source: Trading View News
That news catapulted Qualcomm into a highly lucrative market, that has sent revenues, at rival Nvidia soaring, over the last three years or more.
Not surprisingly, the QCOM share price jumped sharply higher on the announcement.
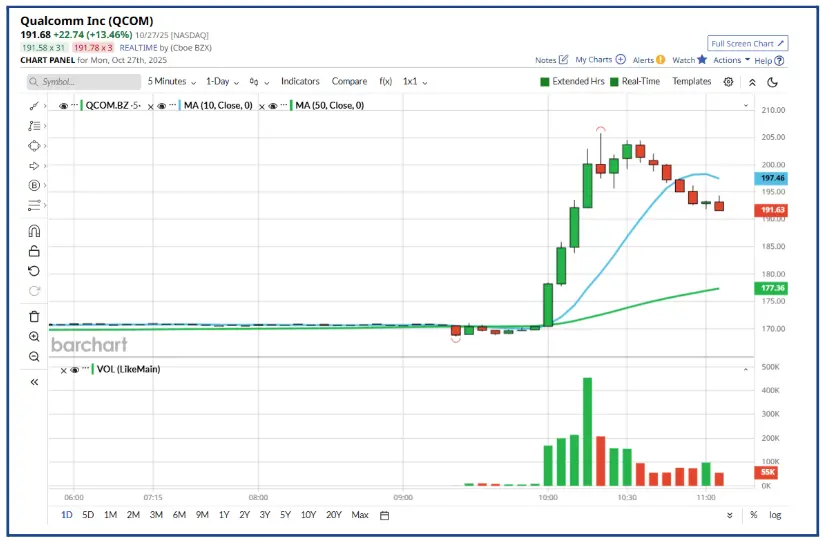
However, as we can see below, the jump up in the Qualcomm stock price, didn't happen all at once.
Rather, as with the move in QBTS, it played over an extended period of time.
And was also characterised by a series of rising, bullish, green candles, illustrated in the 1-day 5-minute chart below.

Source: Barchart.com
Once again the move higher was accompanied by decent volume (see the lower chart window).
At one point Qualcomm was up as much as +20.0% on the day, before correcting.
In this instance, the chart highlighted the “top of the move “ for us, by posting a negative candle pattern, known as a “shooting star”.
Which showed the potential for a price reversal, or retracement, after the appearance of the 4 bullish, green candles.
The takeaway from all this is that opportunities can and do present themselves throughout the trading day.
You can't easily plan for changes in sentiment, and unexpected newsflow.
However, you can react to them
And, as these two examples have shown us, the window of opportunity in which to do so, can be open for longer, than you might expect it to be.
The information provided does not constitute investment research. The material has not been prepared in accordance with the legal requirements designed to promote the independence of investment research and as such is to be considered to be a marketing communication.
All information has been prepared by ActivTrades (“AT”). The information does not contain a record of AT’s prices, or an offer of or solicitation for a transaction in any financial instrument. No representation or warranty is given as to the accuracy or completeness of this information.
Any material provided does not have regard to the specific investment objective and financial situation of any person who may receive it. Past performance is not a reliable indicator of future performance. AT provides an execution-only service. Consequently, any person acting on the information provided does so at their own risk. Forecasts are not guarantees. Rates may change. Political risk is unpredictable. Central bank actions may vary. Platforms’ tools do not guarantee success.