
Over the last month, we have touched on the health or otherwise, of the US consumer several times.
The thinking is that interest rate cuts will support consumer spending through the balance of 2024 and beyond.
The world’s biggest retailer Walmart WMT US seemed to support that view when it reported forecast-beating earnings on August 15th. The CEO said the firm was
“experiencing higher engagement with (customers) across all income cohorts”.
Or to put it another way, the business was attracting shoppers from high and low-income households across the USA.
And yet on Thursday Dollar General, a discount retailer, with 19,650 stores across North America, said that its
“Core customers were feeling financially constrained”.
Dollar General missed on earnings guided lower and said it would be spending more on promotions and discounts going forward.
Can the charts provide any clues?
Two retailers and two very different views about the consumer. So who is right?
The chart below shows the price performance of Walmart in black versus Dollar General in green, over the last 10 years It is very noticeable that Walmart's stock price has continued on an upward trajectory during this period.
However, Dollar General’s stock price took a turn for the worse in late 2022, from which it hasn't recovered.
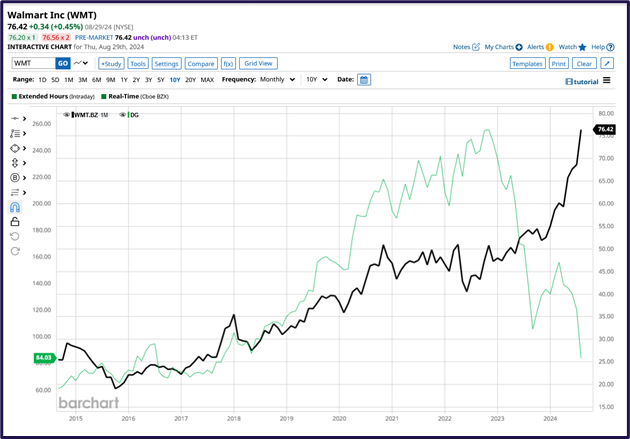
Source: Barchart.com
Indeed Dollar General stock plunged by a whopping -32.00 % in Thursday’s trade, a move we can see on the right-hand side of the next chart, which overlays quarterly earnings at the company, onto the price line.
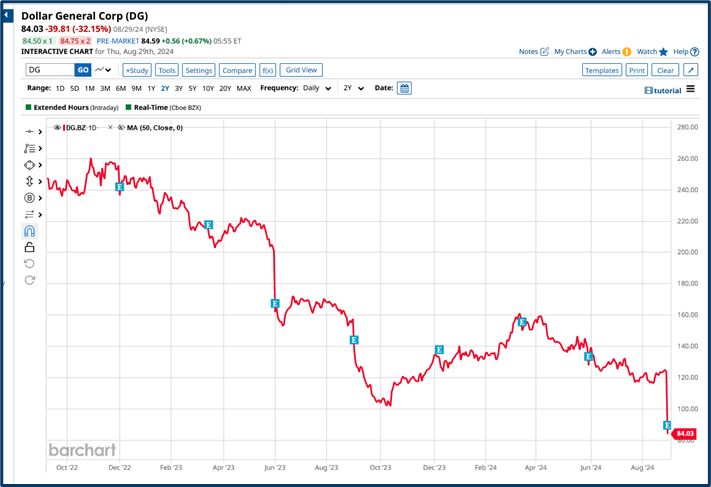
Source: Barchart.com
The takeaway from this chart for me is that earnings have largely been disappointing or have disappointed the market over the last two years.
And that Q2 2024 numbers were just the latest in a long and growing track record of poor performance at Dollar General.
A brighter outlook
There were earnings from another major US retailer on Thursday in the shape of electrical appliance chain Best Buy BBY US, which reported an earnings beat, raised its guidance and rallied by +14.11%.
Best Buy operates far fewer stores than Dollar General and sells much bigger ticket items than the discounter.
And yet the electrical retail space remains highly competitive not least because of the presence of e-commerce titans like Amazon.
Best Buy CEO Corrie Barry said:
“We delivered strong results in our Domestic tablet and computing categories, which together posted comparable sales growth of 6% versus last year. With our market position, expert sales associates and compelling merchandising, we capitalized on the demand driven by customers’ desire to replace or upgrade their products combined with new innovation.”
Looking at the two-year chart of Best Buy, with a quarterly earnings overlay, we can see that there has been rising momentum post earnings, more often than not, and notably since late 2022.
The very point at which Dollar General’s fortunes went into reverse.
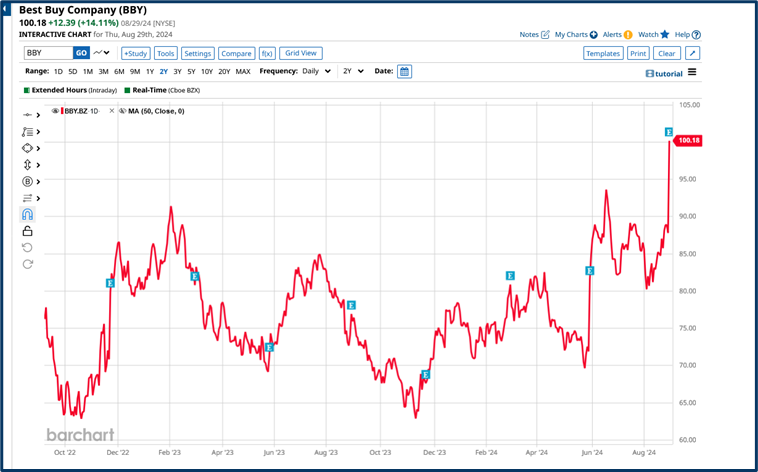
Source: Barchart.com
The takeaway here is that success and failure don’t really happen in isolation, rather there are chains of events and circumstances that lead up to and create either a positive or negative situation.
A sharp stock price change is often what brings the news to the attention of traders and investors. But looking at the charts above, none of this should have been a surprise, if we had taken the time to look back at recent history.
Why does any of this matter?
It matters for two reasons:
Firstly because it highlights the opportunities for traders that are created by the diverse fortunes of stocks with the consumer-facing sectors in the US.
After all, long Best Buy and short Dollar General would have been the perfect pairs trade.
Though of course, that’s far easier to say in hindsight than to implement in real time.
Although for what it's worth I had spotted the potential in Best Buy.
And I posted on it in one of my trading discords at the end of May, then once again in late July and finally on the 28th of August, just one day ahead of its earnings, when I asked if we would see a “Retail Renaissance?” in the stock.
Looking back I hadn’t commented on Dollar General since mid-March, when I was less than complimentary about the shares.
Interesting as this is, there is a much bigger and more important reason for traders to be interested in the US consumer.
This is illustrated by the chart below which captures the percentage of US GDP made up by personal consumption and expenditure or PCE which as of Q2 2024 stands at 67.70%.
GDP, or Gross Domestic Product is a measure of the value of all activity within an economy.
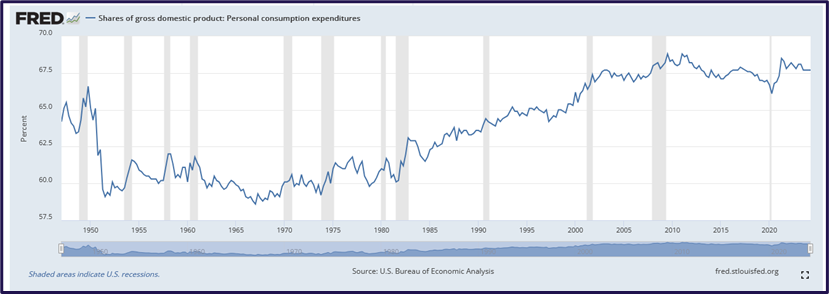
Source: Fred/St Louis Fed
For the US right now that figure stands at around $27.36 trillion.
And according to Trading Economics that represents just under 26.0% of total global GDP.
Using some back-of-an-envelope maths that means that US consumers and their spending habits, approximately account for just under a fifth of the global economy.
This is astounding and more than enough reason for traders to pay close attention to consumer-centric data and events.
The information provided does not constitute investment research. The material has not been prepared in accordance with the legal requirements designed to promote the independence of investment research and as such is to be considered to be a marketing communication.
All information has been prepared by ActivTrades (“AT”). The information does not contain a record of AT’s prices, or an offer of or solicitation for a transaction in any financial instrument. No representation or warranty is given as to the accuracy or completeness of this information.
Any material provided does not have regard to the specific investment objective and financial situation of any person who may receive it. Past performance is not a reliable indicator of future performance. AT provides an execution-only service. Consequently, any person acting on the information provided does so at their own risk.