
After a period of market dislocation, which is a polite way to describe what we saw in the week of August 5th, the market and its participants need a reset. An opportunity to gather themselves, take stock of what happened, and think about how that’s left us, and what might come next.
Suppose we think of recent events as a spike in volatility, bought on by a change in sentiment.
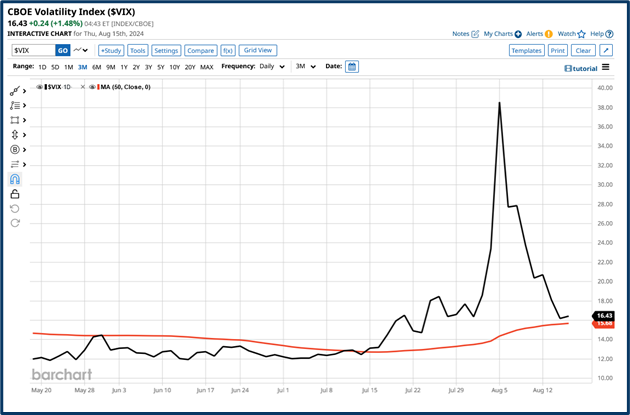
Then judging by this chart we are heading towards (if not already back at), normality.
After all the VIX has lost more than -40.00% over the last week and fell by -10.00% on Wednesday alone.
Source:Barchart.com
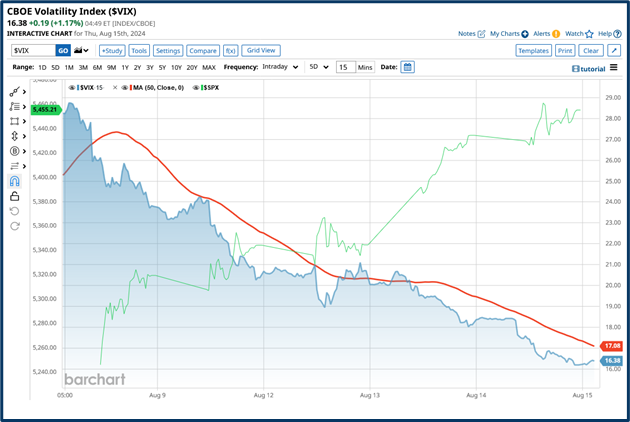
And, as the VIX fell, the S&P 500 rose- it's added +4.90% over the last 5 days as of the time of writing.
Source:Barchart.com
It’s also reduced its monthly losses and remains up by +14.37% over the year to date.
Of course, the recovery among index members isn't as evenly distributed as the headline numbers suggest.
There is an old saying that's been adopted by the market which describes the irrational behaviour among traders, during times of stress.
When they are said to have “Thrown the baby out with the bath water”
The opportunity after those periods of stress lies in finding hastily discarded “gems".
There are various ways we can do this
For example, by looking at valuations of stocks and sectors, or by looking at their relative performance.
That's an approach that appeals to me and with that in mind, I created a screen of the S&P 500 in which I looked for stocks that had posted new 5-day highs this week.
Given what happened the week before, and the performance we have seen this week, you won't be surprised to hear that this screen returned well over 380 stocks.
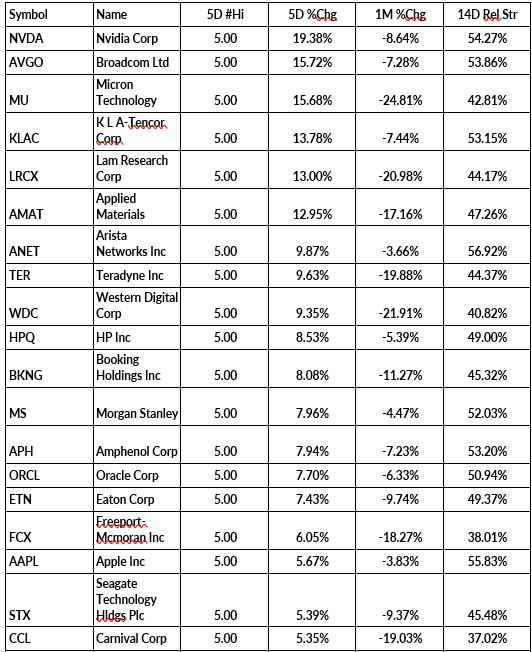
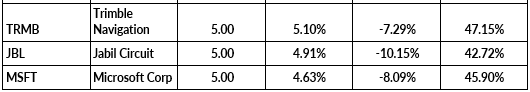
To filter this list further, I then looked for stocks which had underperformed the wider markets over the last month and ranked those stocks by the number of new 5-day highs they had posted. Selecting those that had posted 5 new highs.
Applying those filters trimmed the list to less than 30 names - a far more manageable number.
Here are those stocks in a table that's ranked by 5-day % changes descending.
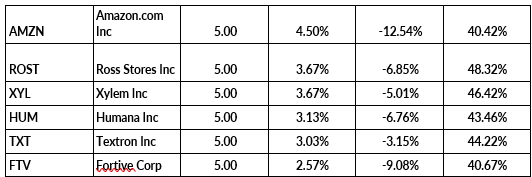
Source: Darren Sinden/Barchart.com
Note that these stocks not only have a positive 5-day performance but they also have a negative 1-month track record, which makes me wonder if that leaves room for further gains.
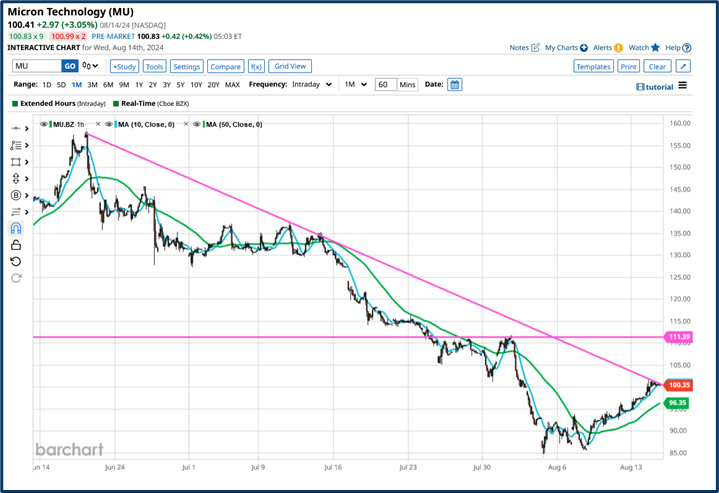
Let’s take high-end memory chip maker Micron Technology MU US as an example.
The one-month chart below looks intriguing. There is a clear downtrend line, a bottom in the price at/around $85.00.
An MA crossover between the 10 and 50-hour moving averages and the price is now testing above the round number of $100.00 per share.
A move which has brought the stock price back into contact with the downtrend line.
Horizontal resistance around $111.20/70 coud act as a potential price target, if, and when the price moves cleanly above both the round number, and the downtrend line.
Source:Barchart.com
Of course, for that to happen we will likely need a catalyst
Micron isn’t due to report until late September, meaning we can't look to earnings to provide near-term impetus.
So if the stock price is to receive a tonic it will need to come from elsewhere.
I also note that Micron’s rivals Western Digital WDC US and Seagate STX US are also in the table above and both have similar-looking charts. Which coud imply that the opportunity here lies at a sector or industry level.
Speaking of opportunities at the sector level
Thursday saw the release of US retail sales data for July which came in at +1.0%, well ahead of forecasts for just +0.30%.
Suggesting that the US consumer is still firing on all cylinders.
That data came on the same day that Walmart WMT US, the world’s largest retailer posted blowout earnings and guided higher. The stock traded up by +8.0% before finishing up by +6.58%.
US consumers account for as much as 70% of US GDP, and whilst they are spending freely its hard to imagine that a recession is on the horizon.
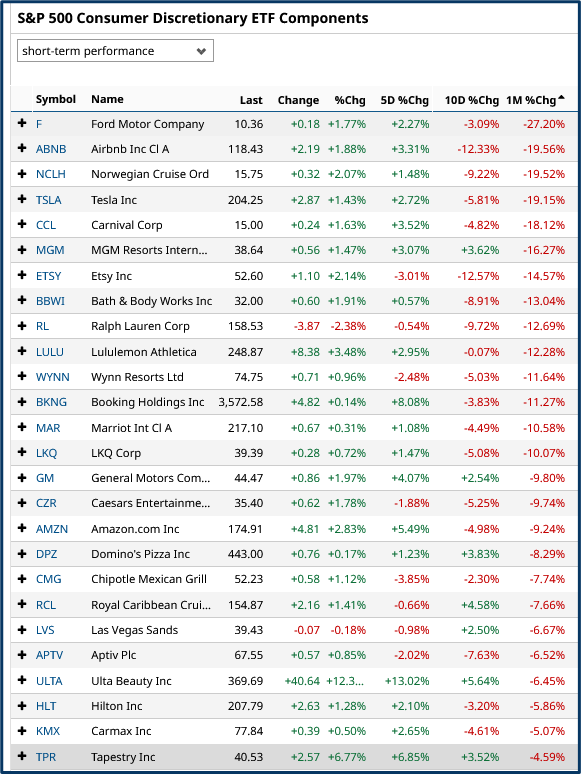
Now interestingly the S&P 500 Consumer Discretionary sector has been the big underperformer over the last month.
The table below, which was created midweek, ranks the worst-performing stocks in the sector by their one-month percentage change, ascending
Even after rallying by almost +3.40% on Thursday, the Consumer Discretionary sector is still down by --5.00%, over the last month, compared to a -1.56% loss for the S&P 500 as a whole.
And if the economic outlook is not as bleak as it was previously painted, then that underperformance may no longer be justified, if indeed it ever was.
Source:Barchart.com
A stock like Norwegian Cruise Lines NCLH is a prime example of what might be available from a re-rating of the Consumer Discretionary sector. The stock rallied by +5.64% in Thursday's session.
However, as we can see on the one-month chart below, there is still plenty of upside potential available.
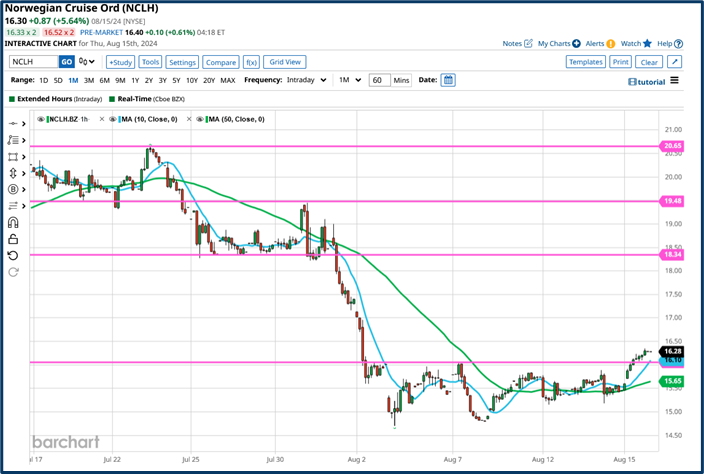
Source:Barchart.com
Now we can't be certain that the potential energy in the stock, or any others in the sector, can be converted into kinetic energy, or further price gains.
However, it seems clear to me that the data mentioned above is likely to be supportive of a change in sentiment towards the sector, and that is half of the battle when it comes to stock selection.
The information provided does not constitute investment research. The material has not been prepared in accordance with the legal requirements designed to promote the independence of investment research and as such is to be considered to be a marketing communication.
All information has been prepared by ActivTrades (“AT”). The information does not contain a record of AT’s prices, or an offer of or solicitation for a transaction in any financial instrument. No representation or warranty is given as to the accuracy or completeness of this information.
Any material provided does not have regard to the specific investment objective and financial situation of any person who may receive it. Past performance is not a reliable indicator of future performance. AT provides an execution-only service. Consequently, any person acting on the information provided does so at their own risk.