
As we approach the start of Q2 2024 earnings season in the US, and with the S&P 500 having made new all-time highs in June. it seems like the perfect moment to take stock of where we are right now in the US equity markets.
The tables and charts below (from Goldman Sachs) provide us with a snapshot of what’s going on in the S&P 500 right now.
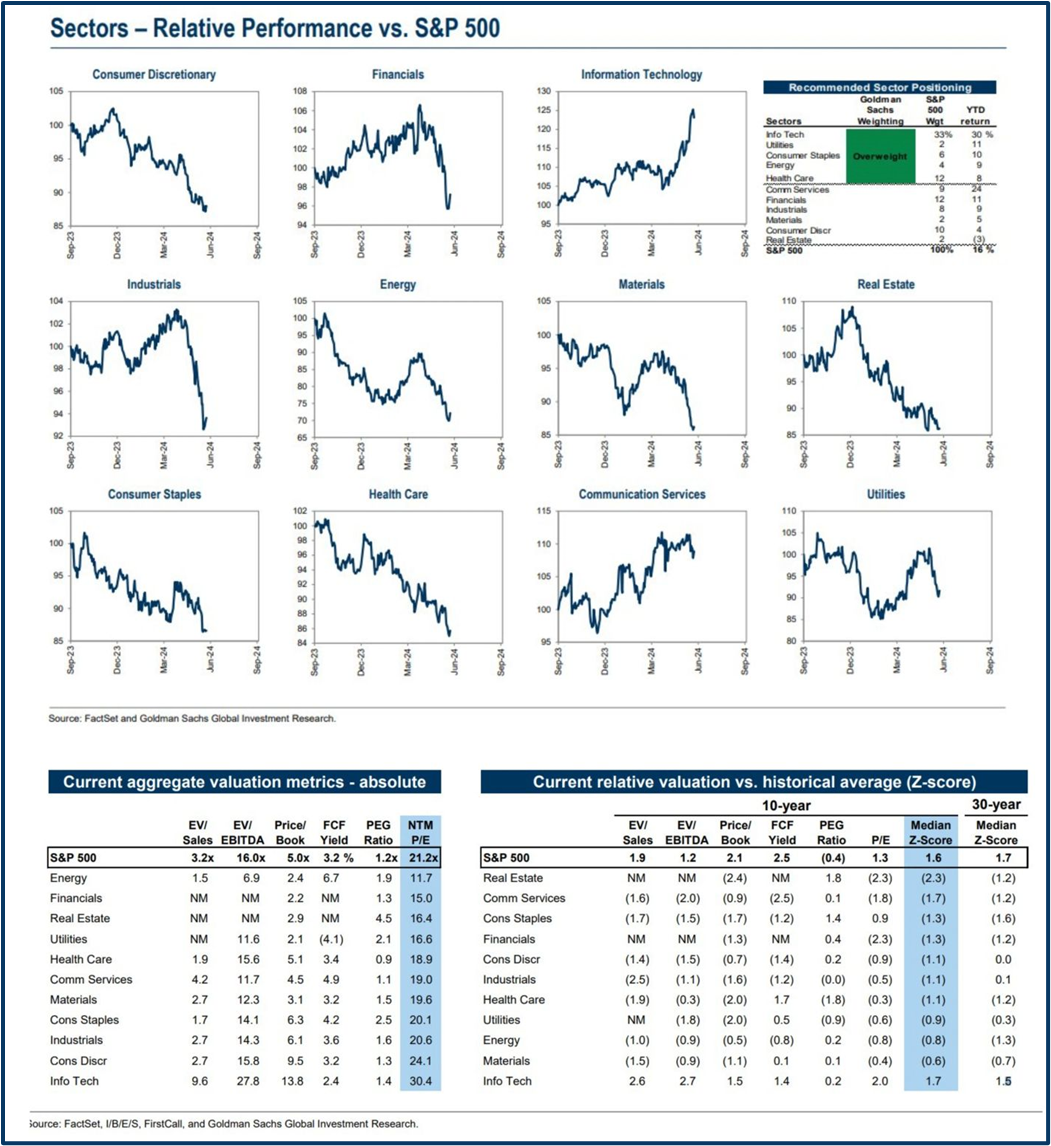
At a sector level information Technology and Communications Services are the only two groupings that are outperforming the S&P as a whole.
Pretty much everything else is underperforming, and quite dramatically so:
Healthcare, Real Estate, Industrials and Materials are all way behind the index, for example.
Source: Goldman Sachs Research
Overvalued?
When it comes to current valuations, the Consumer Discretionary and Information Technology sectors are trading on a higher forward PE than the S&P 500 as a whole, at 24.1 and 30.40 times respectively. Versus a figure of 21.2 times earnings for the wider index.
Those same sectors also have the highest price to book ratios (price to book compares the value of a company’s assets to its current market valuation) at 9.50 and 13.8 times.
Both of these ratios are far in excess of the index average of 5.0 and the ratios for all other S&P 500 sectors.
The takeaway here then is that the S&P 500 is still being led by a narrow group of stocks, drawn from just a few key sectors, whilst the majority of stocks are being “left behind”.
Narrow breadth and outperformance
We can get a sense of that narrow breadth and outperformance, in this chart which plots the percentage change in the S&P 500 index in blue, against that of an ETF that tracks the S&P 500 equal weight index.
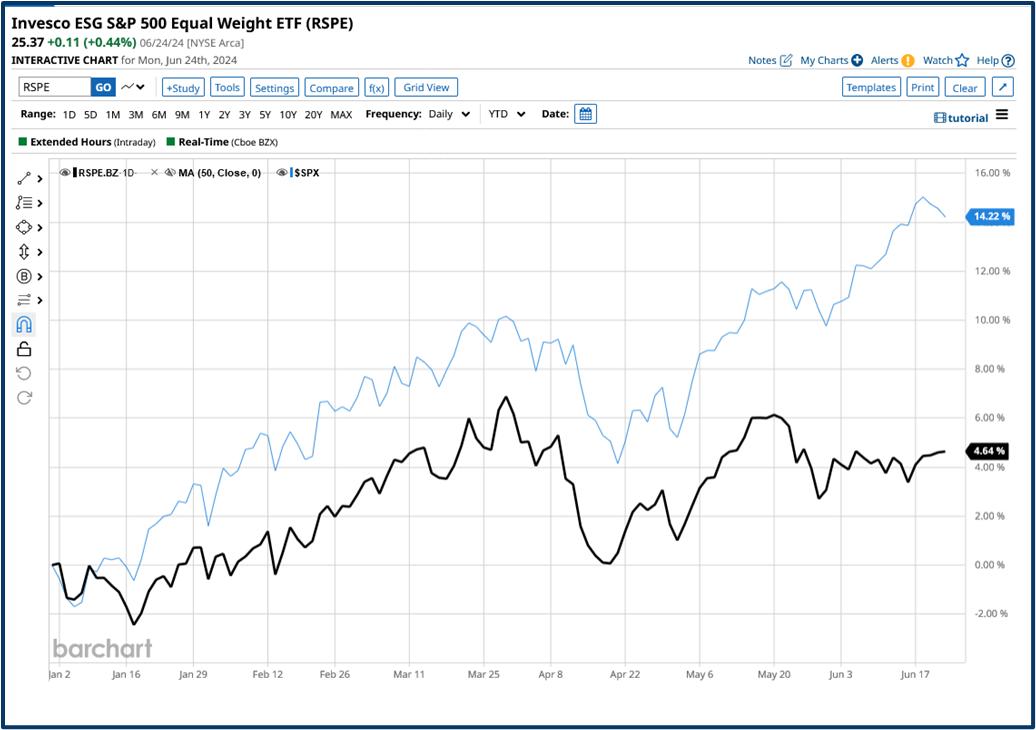
Source: Barchart.com
Size matters
The S&P 500 is market cap weighted index, in which the largest companies have the biggest influence.
The equal weight version of the index, treats all companies the same, regardless of their market cap.
As we can see the cap weighted version of the index has risen by some +14.20 over the year to date, whilst the equal weight index has gained just +4.64% in that period.
If we dig a bit deeper and look at the performance of individual S&P 500 stocks, year to date, we find that just 138 stocks have beaten or outperformed the wider market in 2024.
However, if we look for stocks that have outperformed by factor of 5.0 or greater, then that number falls to just 94 stocks.
And if we filter for stocks whose degree of outperformance has reached double figures, then we are left with a list of 63 S&P constituents.
Look for stocks that have beaten the market by a higher margin still and the list rapidly slims down once again.
S&P 500 hundred stocks that have outperformed the wider market by a factor of 30.0 or more.
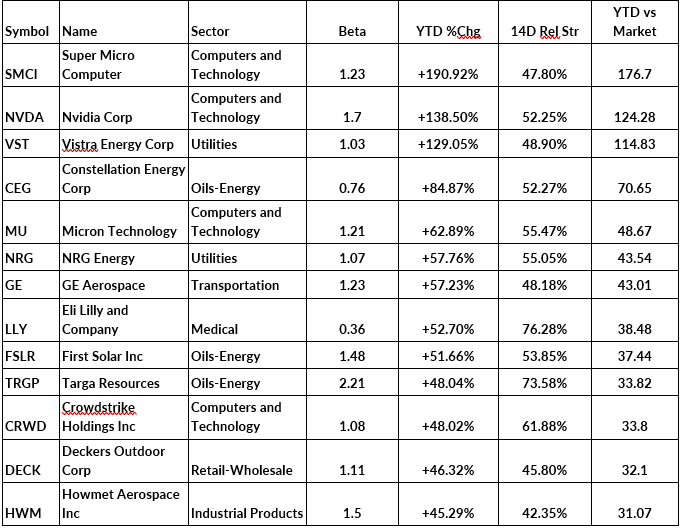
Source: Barhart.com / Darren Sinden
Changing tastes and returns
Perhaps this shouldn't surprise us because valuations were the major factor in S&P returns at the start of the decade, whilst the impact of dividends and earnings was static or receding.
Those trends seem to be continuing as we move further into the 2020s.
Earnings season is just a few weeks away
The big US banks start to report on July12th and Q2 earnings season gets into full swing thereafter.
Given all the above, however, we could be forgiven for thinking that the market won’t be too concerned about earnings and revenues from the rank and file of the S&P 500.
Though the data could shed light on how the economy and the US consumer are faring, and also create some trading opportunities in stocks and sectors that have been overlooked or ignored.
What will matter presumably will be the earnings and outlook of the Magnificent 7 stocks, and as the S&P inches higher, driven by fewer and fewer stocks, those earnings will matter even more.
Nvidia only recently published its Q1 2024 results so it won’t be reporting again until August.
However, others in the group Namely Microsoft, Tesla and Alphabet will be reporting in July.
Which sounds like a long way off but is only really a week away.
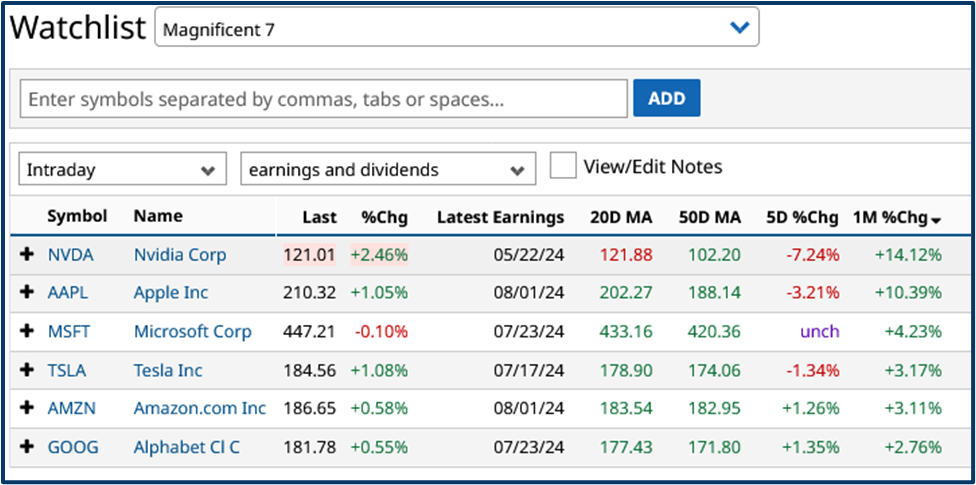
Source: Barchart.com
The information provided does not constitute investment research. The material has not been prepared in accordance with the legal requirements designed to promote the independence of investment research and as such is to be considered to be a marketing communication.
All information has been prepared by ActivTrades (“AT”). The information does not contain a record of AT’s prices, or an offer of or solicitation for a transaction in any financial instrument. No representation or warranty is given as to the accuracy or completeness of this information.
Any material provided does not have regard to the specific investment objective and financial situation of any person who may receive it. Past performance is not a reliable indicator of future performance. AT provides an execution-only service. Consequently, any person acting on the information provided does so at their own risk.