
I was out of the office on Wednesday afternoon as I ventured into the City of London for a combination of meetings and social engagements. While I was out of office the world, or a large portion of it as far as equities are concerned, appeared to turn on sixpence (that’s a small, pre-decimal UK coin).
Sentiment spun around by 180 degrees sellers appeared to have evaporated and buyers who had been absent for a month, or at least that’s what it felt like, were suddenly everywhere.
Tech stocks in particular were in demand led of course, by Nvidia NVDA US.
The table below shows selected Nasdaq 100 stocks, ranked by their daily percentage change on July 31st
Note that many stocks in this list, not only posted good gains but did so on rising volumes.
For example, Qualcomm QCOM US put on almost +8.40% on the day and experienced a +113.0% improvement in the volume of its stock traded.
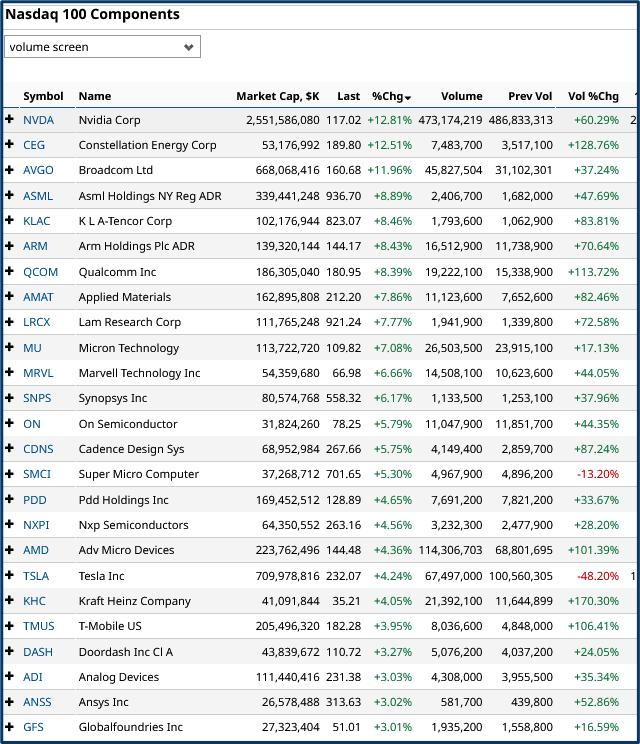
Source: Barchart.com
The moves weren’t uniform
Not everything was quite so positive. Tesla TSLA US rallied by +4.24%.
However, those gains were made on declining volume. The volume traded in TSLA on Wednesday almost halved, when compared to Tuesday's turnover.
Why we saw such a marked decline in TSLA volumes is unclear, and it’s in stark contrast to the two previous days on which the stock recently rallied, as you can see below.
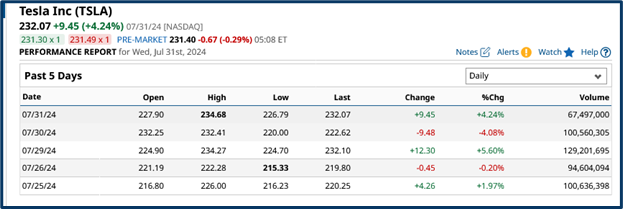
Source: Barchart.com
Low-volume rallies
Low-volume rallies are nowhere near as positive in terms of price action as rallies that are made with higher volume levels.
Perhaps there were too many other things happening simultaneously on Wednesday, and Tesla traders were distracted, simply or busy elsewhere.
Tesla wasn't alone in posting gains on declining volume among Nasdaq 100 stocks in Wednesday's session.
The table below captures the other stocks within the index, that met this criteria. Tesla's volume slump was the biggest, however.
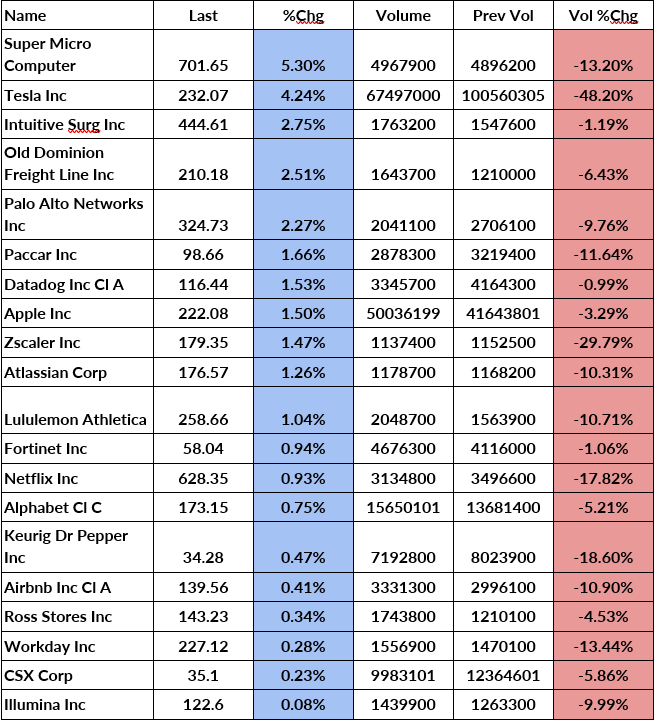
Source: Darren Sinden
We need to see how things finish this week before we can jump to any lasting conclusions, but this is the sort of market intelligence I pay attention to.
Big gains but not the strongest
Despite Nvidia posting the biggest daily gain on Wednesday, it wasn't the strongest of the mega-cap technology stocks, at least not according to my Smile chart, which measures what I refer to as Price Action Relative strength or PARS.
That honour fell to Broadcom AVGO US which was further over and higher to the right in the technology Smile as of the close on Wednesday.
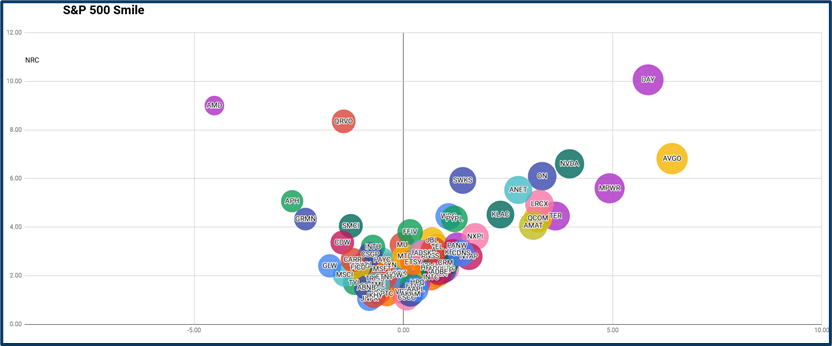
Source: Darren Sinden
Top 100 gains
Nasdaq 100 closed over 3.0% higher on Wednesday so where does this gain rate concerning the past year?
Well, the table below shows us the top 20 daily percentage gains in the Nasdaq 100 index over the last 12 months.
Wednesday’s move was the joint highest gain in the index over the last year.

Source: Darren Sinden
July was a roller coaster month for tech stocks.
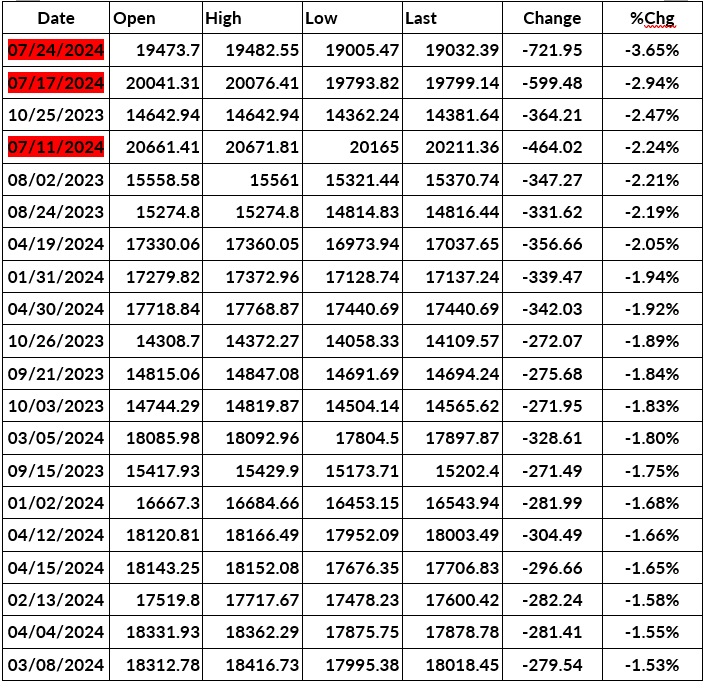
Our second table contains the 20 biggest percentage losses in the Nasdaq 100 over the last 12 months.
Three of those, which are also in the top 4, came in the last month.
Source: Darren Sinden
Was it a surprise?
Perhaps we shouldn't have been surprised by these sharp swings, because there were signals and indicators, that suggested this was possible, and even quite likely.
Consider this quote:
"Meanwhile, a complementary measure of U.S. equity market risk, the CBOE S&P 500® Dispersion Index (DSPX), has surged to multi-year highs in the mid-thirties—suggesting the market expects unusually large swings in single stock prices during earnings season."
That’s from the S&P Dow Jones Indexology blog posted in mid-July.
Once again it seems that the clues were out there if you knew where to look.
The information provided does not constitute investment research. The material has not been prepared in accordance with the legal requirements designed to promote the independence of investment research and as such is to be considered to be a marketing communication.
All information has been prepared by ActivTrades (“AT”). The information does not contain a record of AT’s prices, or an offer of or solicitation for a transaction in any financial instrument. No representation or warranty is given as to the accuracy or completeness of this information.
Any material provided does not have regard to the specific investment objective and financial situation of any person who may receive it. Past performance is not a reliable indicator of future performance. AT provides an execution-only service. Consequently, any person acting on the information provided does so at their own risk.