All markets move through periods of growth and periods of slowdown. This recurring pattern is known as an economic cycle, with recognisable phases that traders can look out for.
The economic cycle has a series of different conditions that occur, like expansion, slowdown, recession and recovery. By looking for signs of which of these phases we’re moving into, traders hope to perform better when buying and selling shares or other assets.
This is because the different phases of the economic cycle tend to see a variety of assets and strategies perform better than others. The economic environment varies according to which phase of the cycle we're in, and that makes it a crucial piece of information to take into account.
What Is the Economic Cycle?
We can start by looking at the idea of the economic cycle in general. This is a phrase that’s used to describe how economies naturally move through phases. Expansion and contraction are the two major phases that we see economies move through over time.
Economic activity isn’t fixed. Instead, it rises and falls. These movements influence a variety of factors, such as employment, the financial markets and company profits.
Central bank policies vary according to the phases of the economic life cycle. The ActivTrades guide "What Is Quantitative Easing (QE) and How Does It Impact Stocks?" gives you the details you need to know about the way QE is used in certain phases.
The Stages of the Economic Cycle
Investors need to know about the various recognisable phases of the economic cycle. These are the elements you need to understand to see how GDP and consumer spending are likely to react in the future.
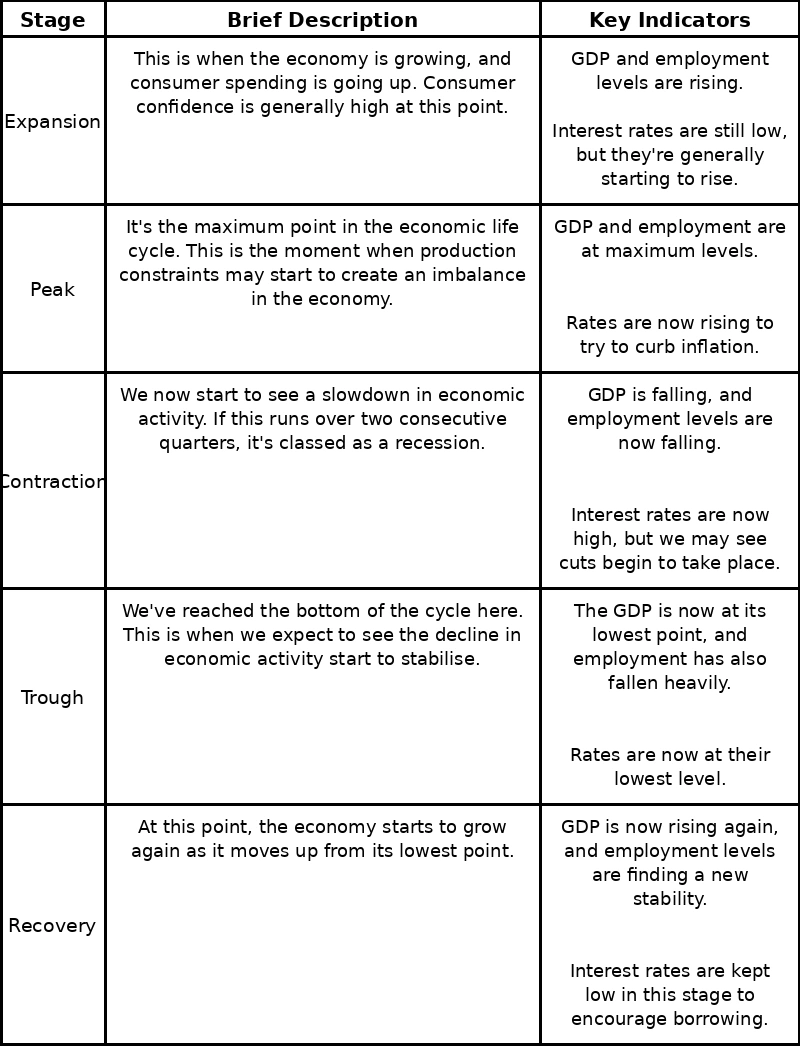
These economic cycle phases are repeated over and over again, although the exact details may vary each time.
Understanding the Economic Cycle Graph and Market Signals
Given the repetitive nature of the economic life cycle, it’s easy to understand why so many people find it easier to look at a visual representation of the process.
This is why economists and analysts typically use charts that let them see at a glance how the economy moves across the different parts of the cycle. An economic cycle graph is normally seen as a wave-type pattern that moves around the long-term growth trend line showing the potential GDP.
The wave is then the actual GDP that shows the fluctuating GDP reality. We normally see this graph broken down into the four phases, known as expansion, peak, contraction, and trough.
· The Peak. This is where the wave reaches the highest point in the cycle. This shows when the economy gets to the overheating stage and is above the trend line.
· The Trough. We see the lowest point here. It’s the moment where the recession ends and a new period of expansion begins.
· Expansion. This part is the upward slope where we can see the GDP moving towards its peak.
· Contraction. Here, we watch the downward slope that shows us the way the economy slows and slides into a recession.
The distance between the wave and the trend line tells us the size of the output gap at any time. If it’s positive, this means that the wave is above the trends. This shows us that the economy is now growing at a faster rate than is sustainable, potentially leading to an increase in inflation.
If we see a negative output gap on this economic cycle chart, it means that the economy is running under its maximum potential. This often ties in with high unemployment, while factories run well below their maximum capacity.
When we look at the wave over a short timeframe, it looks dramatic. Over a longer period, we can see that it reflects the shifts in a country’s technology, infrastructure, and the other elements that define its standard of living.
Trading Strategies for Different Economic Cycle Phases
Each phase of the economic cycle provides the right conditions for certain assets or sectors to flourish, meaning that rotation is a vital strategy. This guide to “Sector Rotation Explained: How Capital Flows Between Industries" explains how it works.
This approach works best when the right strategy is applied at the appropriate time, as we can see in the ActivTrades guide to “Trend vs Range Trading: Which Is Better?".
Using the economic cycle stages as part of a strategy is mainly about trying to rotate into the assets that are likely to benefit most from the conditions in each stage. Traders need to take into account the current economic indicators and market trends, while understanding the phases.
During a period of expansion, traders often have a greater appetite for risk. With the economy growing and people spending more money, they may focus on growth stocks in areas like technology and luxury goods.
As we move into the peak, the slowdown may see interest rates being raised. This is when many traders start taking profits from their investments and move into value stocks that are less likely to be affected by interest rate hikes.
In the recovery, or trough, phase, the economy is beginning to bounce back after hitting rock bottom. Traders may see this as a turning point where they can track down oversold assets that have declined too far during the downturn. Real estate and industrials are sectors that may lead the way forward.
Economic Cycle FAQs for Traders
How Do I Know What Phase of the Economic Cycle We Are In?
The various factors we looked at in this article are used by traders to understand which phase we are in. The GDP, employment rate, and interest rates are all important pieces of information.
How Is Sector Rotation Linked to the Economic Life Cycle?
Traders tend to move their investments from one industry or sector to another according to the current stage of the economic cycle. In the slowdown stage, money typically heads into defensive sectors, while it goes into growth areas during expansion.
The information provided does not constitute investment research. The material has not been prepared in accordance with the legal requirements designed to promote the independence of investment research and as such is to be considered to be a marketing communication.
All information has been prepared by ActivTrades (“AT”). The information does not contain a record of AT’s prices, or an offer of or solicitation for a transaction in any financial instrument. No representation or warranty is given as to the accuracy or completeness of this information.
Any material provided does not have regard to the specific investment objective and financial situation of any person who may receive it. Past performance is not a reliable indicator of future performance. AT provides an execution-only service. Consequently, any person acting on the information provided does so at their own risk.