Momentum can be thought of as the tendency for an object that’s moving in a particular direction, to continue to move along that trajectory and to accelerate as it does so.
Originally a term applied in physics, momentum is regularly used when traders talk about or describe the markets and the price-action within them.
And whilst you might think that momentum in the markets is a modern concept, that’s not necessarily the case.
Centuries-old
Research published in 2014 by systematic Hedge Fund AQR showed that the premium or excess returns generated by a momentum strategy were detectable in 212 years' worth of US stock market data.
The AQR study looked at the performance of US stocks between 1801 and 2012 and UK equity data dating back to the reign of Queen Victoria among others.
I am not surprised by that because if you spend an extended period in the markets, as I have you come to realise that there really isn't anything new under the sun.
Names and labels may change, along with the technology and market participants, but one constant remains and that’s human behaviour.
Although we are likely approaching a period in which humans may no longer be the only market participants.
Machine learning and AI could, in theory, create autonomous trading bots, which study and trade the markets independently, and do so without our emotional inputs, such as fear and greed, support and resistance and so on.
Momentum’s Performance
MTUM is the ticker for the iShares MSCI US Momentum Factor ETF having an ETF that tracks the momentum stocks means we can easily visualise how these stocks are performing relative to stocks that aren’t exhibiting momentum.
The table below contains price performance data for the ETF between 10 years and 5 days.
As we can see there have been gains across all of these time frames. Though the medium-term performance between 2 and 5 years is probably the most impressive.
MTUM Price Performance

Source: Barchart.com
Here’s how that looks on a chart.
MTUM price chart

Source: Barchart.com
To put momentum performance into context we can compare it to another well-known investing style or factor, Value.
As we can see MTUM has outperformed Value by roughly 2:1 over the last 10 years the spread between the two factors grew wider in March 2020 and again in October 2023
Momentum vs Value

Source: Barchart.com
Momentum and Growth
We can also compare the performance of momentum to an investing style with which it’s closely aligned, namely Growth. I have done this in the chart below.
It's interesting to note that even here there has also been divergence, though perhaps not in the way we might have expected.
Because growth has outperformed momentum and much of that outperformance can be traced back to December 2022. The point at which Growth started to move away from Momentum.
Perhaps that’s something we can investigate further at a later date.
Momentum versus Growth

Source: Barchart.com
Even today and in the face of evidence ranging from academic research to the returns outlined above, there's still much debate about whether Momentum exists. Or at least, if it’s a persistent factor that can be identified and captured on a systematic basis.
And whether it’s “worth the effort” of even trying?
When other factors that are easier to capture, for example, Growth, can provide similar, if not better returns to momentum.
Hiding in plain sight
For me, it's clear that Momentum does exist and whilst it might be hard to offer a definition and methodology, that would satisfy the most demanding quantitative analysts and traders, I think it’s fair to say that you will know it when you see it.
Though you may have to dig around a bit to find it.
For example, you might think that a stock that regularly posted new highs would be a leader as far as price momentum was concerned and that a stock that had posted far fewer new highs would be an underperformer, however, that isn’t always the case.
For example here is Live Nation LYV which has posted 24 new year-to-date highs in 2025. Verus Plantir PLTR, which has posted just 11 new year-to-date highs, and yet it is up +45.64% ytd verus Live Nation’s +15.31% gain so far this year.
Live Nation LYV vs Plantir PLTR

Source: Barchart.com
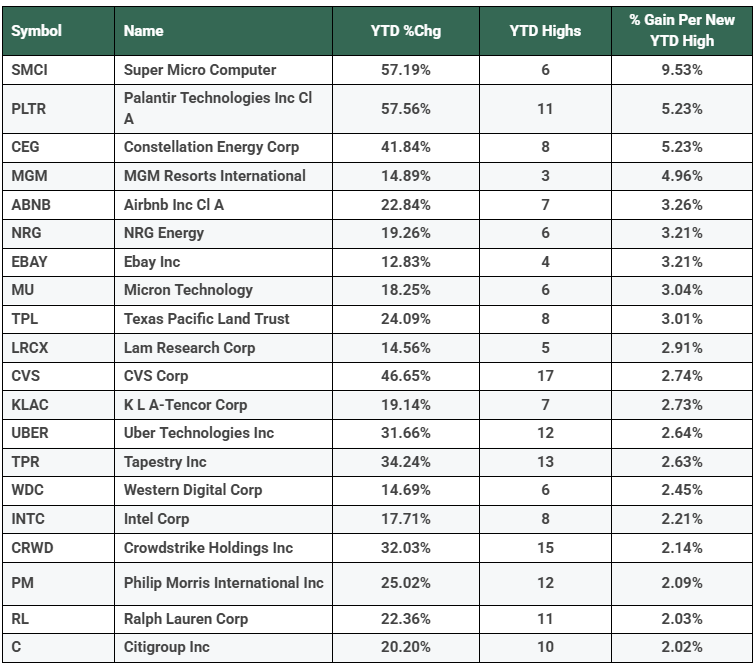
With that in mind here are some stocks which have delivered the biggest bang per buck, that is have had the biggest percentage price gain for each new YTD high they have posted.
Of course, this table tells us nothing about their future performance, and as we well know, past performance is no guarantee of future success.
However, it does show us the kind of metrics that we should perhaps be looking at to identify stocks which have had or are still demonstrating persistent price momentum.
Source: Barchart.com/ Darren Sinden
The information provided does not constitute investment research. The material has not been prepared in accordance with the legal requirements designed to promote the independence of investment research and as such is to be considered to be a marketing communication.
All information has been prepared by ActivTrades (“AT”). The information does not contain a record of AT’s prices, or an offer of or solicitation for a transaction in any financial instrument. No representation or warranty is given as to the accuracy or completeness of this information.
Any material provided does not have regard to the specific investment objective and financial situation of any person who may receive it. Past performance is not a reliable indicator of future performance. AT provides an execution-only service. Consequently, any person acting on the information provided does so at their own risk.