
Modern life is complicated and the markets even more so, which tells me that it doesn’t make sense to add more complexity and complication to either.
Removing complexity from trading has been a recurring theme in the articles I have written in the last couple of years. We can't ignore the fact that markets are the sum of the interactions of millions of traders and billions of pieces of information.
Some of those interactions take place in timescales that aren’t even perceptible to the human eye and mind.
Trying to untangle and understand this web would be a fool's errand unless you are extremely clever, rich and have access to immensely powerful computers.
Most of us aren't in that situation, so we have to try something else to find trade ideas and opportunities. However, that doesn't mean we need to devise some fiendishly complex system or set of rules.
In fact, quite the reverse: 18 years ago, I sat in on a presentation by a leading technical analyst. Two slides from that presentation have stayed in my mind, the first was about how much harder prices have to work to recoup losses after a big fall.
The second contained an acronym KISS which stood for Keep It Simple Stupid.
In other words, don’t overcomplicate your analysis and trading workflow.
Instead, look for tools and methods that you can understand and action, simply and effectively.
Let’s look at some recent examples to illustrate what I am talking about
The image below is a screenshot of a LinkedIn post I made in the first week of January.
In which I highlighted the fact that the S&P 500 Information Technology sector was in oversold territory in the short term.
I used a simple chart with two indicators to make my point. The first was the % of stocks within the sector that were trading above their 5-day moving averages that’s the black line in the upper chart which read 1.56%.
In the lower chart, I have used RSI, but over 5 trading periods rather than 14, which was down at 22%
Both of these indicators were deep in oversold territory and as I said in my post, they were suggestive of a bounce being on the way.
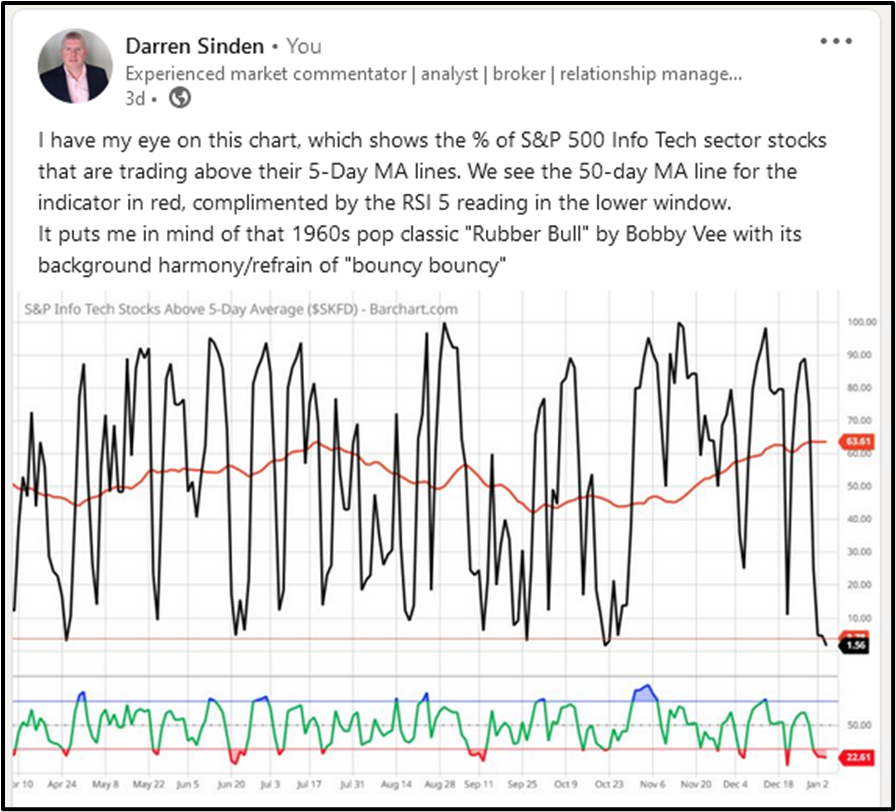
Source: Barchart.com
Our second chart see below shows these indicators as of the close of play on 8/01/2024.
At which point 87.50% of S&P 500 Infotech stocks were trading above their 5-day MA lines, and RSI 5 had moved up to 71.50.
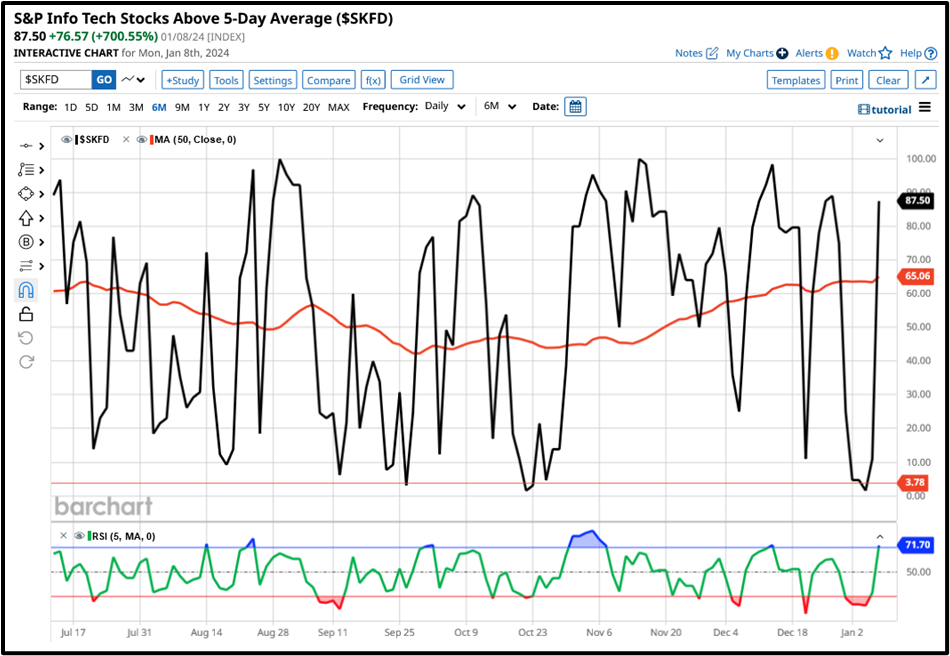
Source: Barchart.com
Here’s how the Nasdaq 100 performed during that period - I am sure you get the idea.
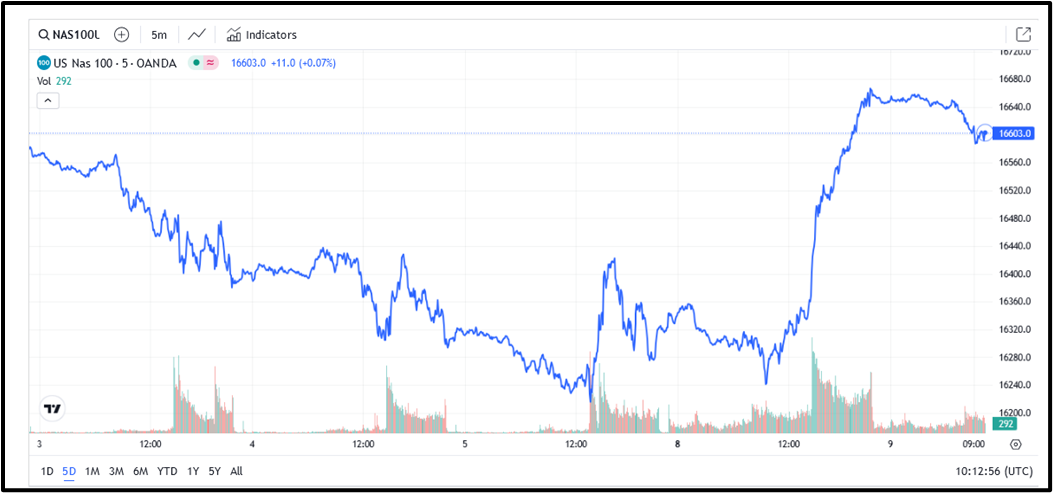
Source: Trading Economics/TV
The other very important point is that these are not expensive proprietary indicators, quite the reverse, they are freely available to users of Barchart.com and Trading View.
Anyone could have spotted this trading opportunity and been on alert for a bounce in Tech stocks, and the wider market, which they have led for most of the last 12 months.
Quick reactions
Spotting a potential turning point in the market such as the one above came about by looking at a predefined set of indicators. However, opportunities present themselves more randomly, for example, sharp moves in stock prices during pre-market trading.
Here is a perfect example of that in the shape of EV battery maker Quantum Scape QS US.
The information provided does not constitute investment research. The material has not been prepared in accordance with the legal requirements designed to promote the independence of investment research and as such is to be considered to be a marketing communication.
All information has been prepared by ActivTrades (“AT”). The information does not contain a record of AT’s prices, or an offer of or solicitation for a transaction in any financial instrument. No representation or warranty is given as to the accuracy or completeness of this information.
Any material provided does not have regard to the specific investment objective and financial situation of any person who may receive it. Past performance is not a reliable indicator of future performance. AT provides an execution-only service. Consequently, any person acting on the information provided does so at their own risk.