
One of the most important skills for a trader is being able to view data and price action in context.
Taking what's happening right now and assessing what this means versus the bigger picture.
Staying rational and detached and not reacting with, or listening to the emotional parts of our brain, can help our decision-making no end.
A perfect example of this would be the recent pullback in US equities.
It was significant no doubt.
We only need to look at the table below to see that a -4.16% decline in the S&P 500 during April, stands out like a sore thumb, within the monthly performance data for the index.
However, when we look at this in context it’s clear that (for now at least) this was a blip.
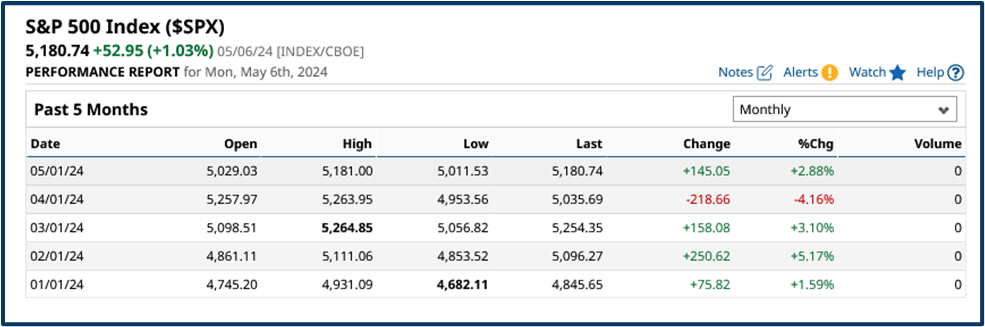
Source: Barchart.com
I say that as someone who predicted the downturn and suggested that the S&P 500 could fall much further than it did, in this most recent correction.
Reading the Signals
Why did I expect US equities to correct and sell off?
I came to that conclusion by looking at and analysing technical indicators and measures of trader sentiment in the US markets, towards the end of March.
At that time I couldn't see anything that looked particularly positive.
Then, the index was testing back towards an uptrend line, that extended higher from October 2023.
And it had already moved below its 10-day moving average.
It would subsequently break below the 50-day MA line, and the 5000 level before rebounding.
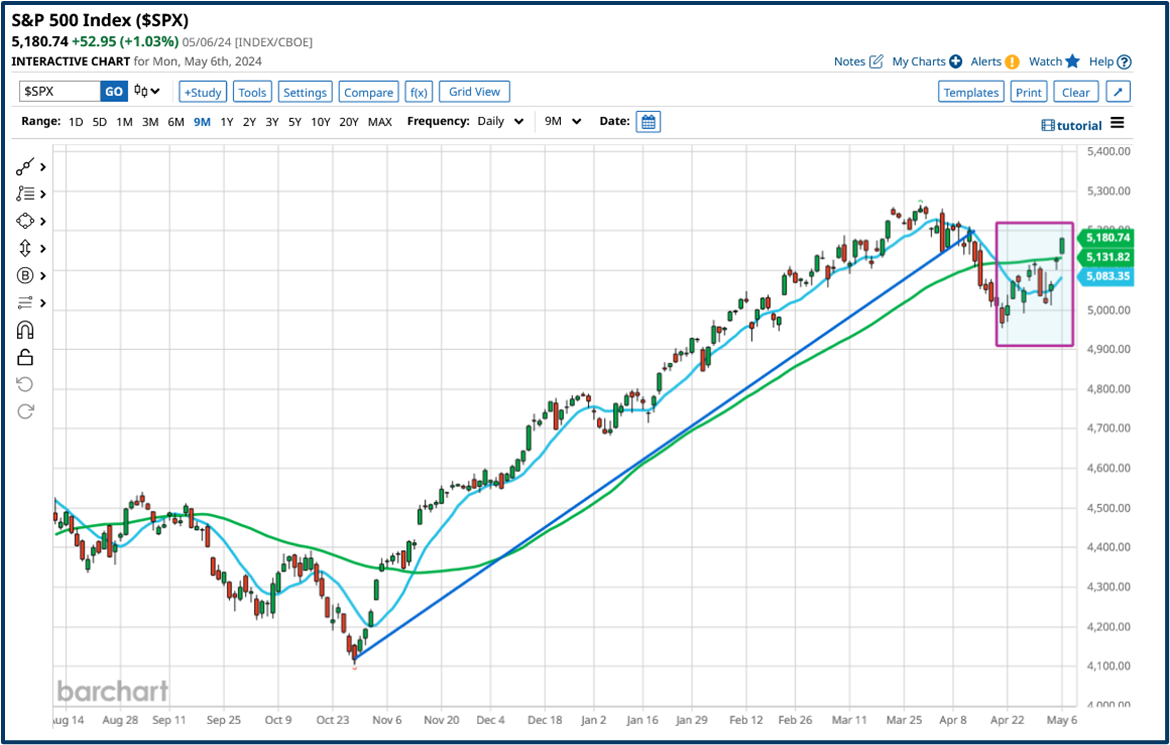
Source: Barchart.com
But rebound it has - rallying back above both the 10 and 50-day MA lines.
Sentiment Turned
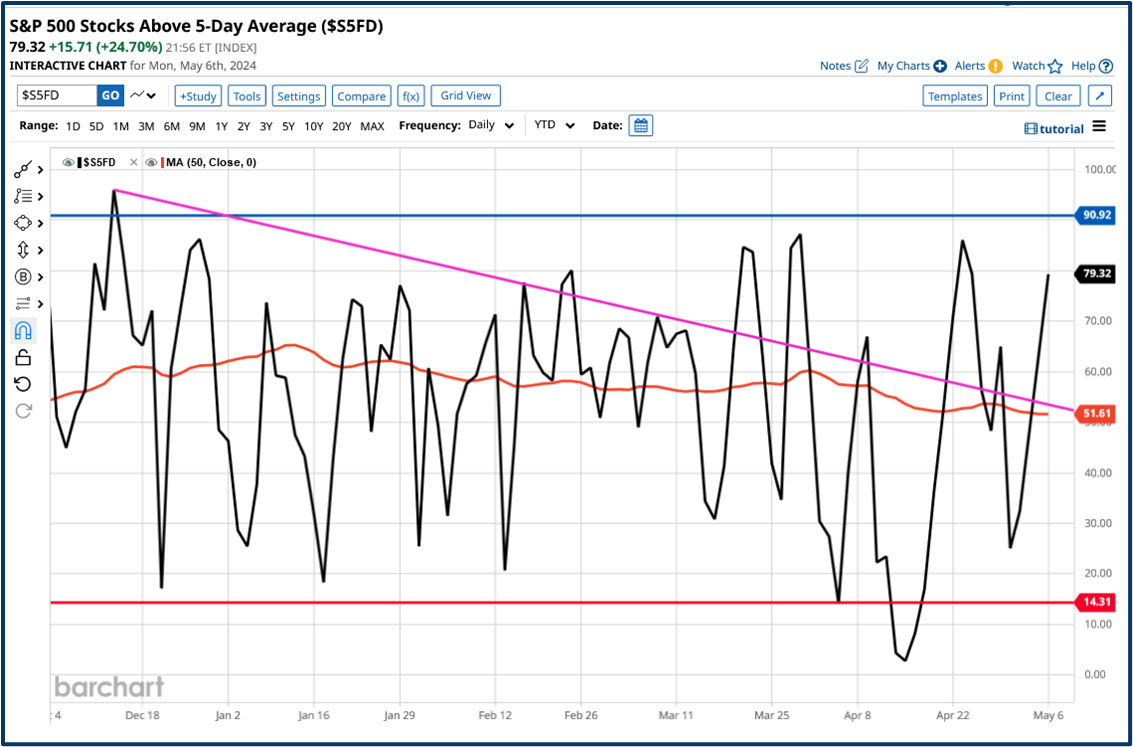
Moreover, we have seen a sharp rebound in short-term momentum, or positive sentiment towards US equities.
As captured by the rapid change in the % of stocks, within the S&P 500 that are trading above their 5-day moving average. (See below)
This indicator had dipped to as low as 3.25%, in early April.
However, it is now back to 79.0%, above its own 50-day moving average, and the downtrend line, drawn from its mid-December peak at 96.0%.
Flexible Thinking
The world-renowned economist and investor John Maynard Keynes said:
“ When the facts change I change my opinion, what do you do sir? “
And the facts have changed as far as the technicals in the S&P 500 are concerned.
Being a successful trader is all about being a pragmatist.
This means rolling with the punches, reading the signals generated by the market, and then adapting your strategy or stance accordingly.
Not doggedly sticking to a point of view, because you think you are right.
You might well be proven correct over the long term, but if you have gone bust in the meantime, by say opposing a trend reversal, that won't be of much comfort to you.
Overreaction and Rebounds
When markets experience a correction, they tend to overreact, and they aren't always discriminating about what stocks and sectors they mark down.
This process of overreaction is often followed by a rebound, or reversion to the mean, as the market moves back towards equilibrium.
In the table below we get a snapshot of the performance of US industry groups during April, and we can see clearly which areas of the market took the biggest hits.
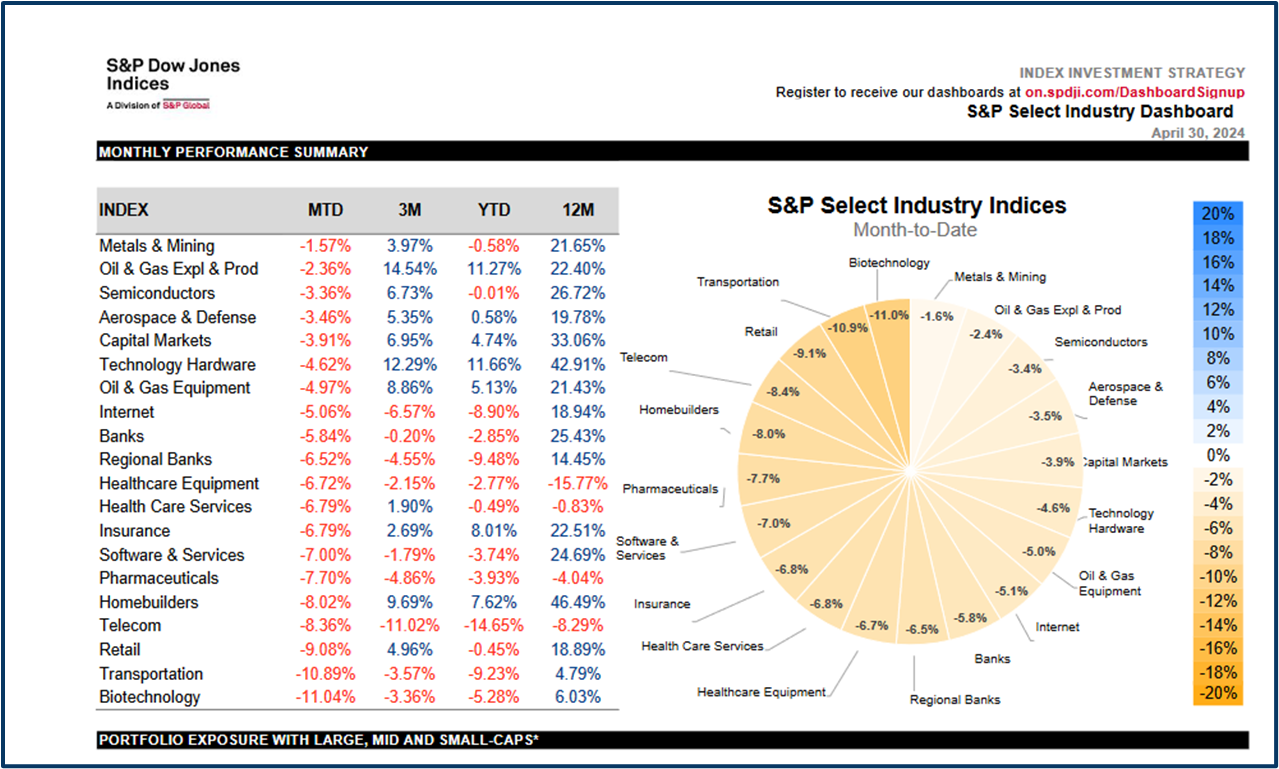
Source: S&P Dow Jones
We can use this type of data to our advantage when looking for trading ideas.
For example, Retailers fell by -9.08% in April, they were the third worst-performing industry group.
However, sentiment turned, following last week's FOMC meeting and Non-Farm-Payrolls data.
Look what that change of direction meant for online homeware and furnishings retailer, Wayfair (W), which reported earnings on Thursday 2nd May.
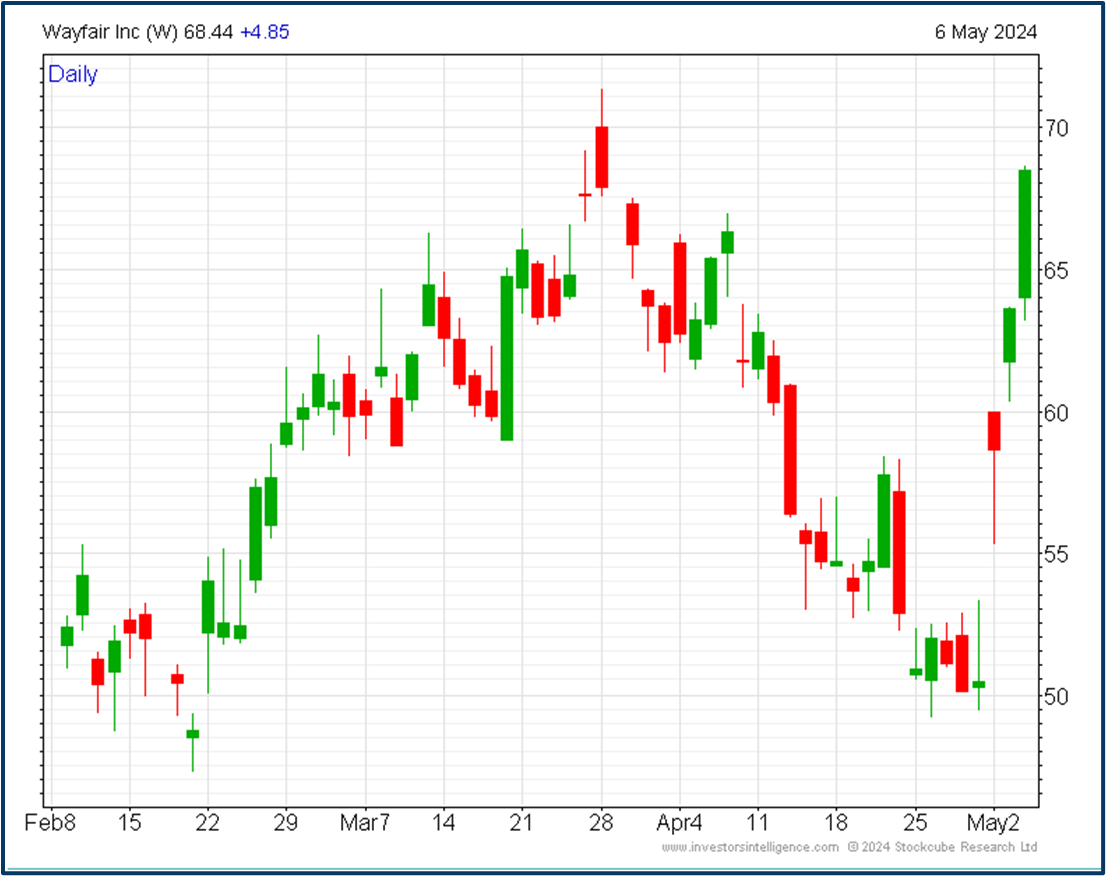
Source: Investors Intelligence
The stock rallied more than +30% in three days.
An extreme example perhaps, but it shows what happens, when markets, and the sentiment within them, swing from one extreme to the other.
These are the opportunities, and market moves that traders live for.
They don't happen too often these days. However, when they do, they are full of bold price action and PnL potential.
The information provided does not constitute investment research. The material has not been prepared in accordance with the legal requirements designed to promote the independence of investment research and as such is to be considered to be a marketing communication.
All information has been prepared by ActivTrades (“AT”). The information does not contain a record of AT’s prices, or an offer of or solicitation for a transaction in any financial instrument. No representation or warranty is given as to the accuracy or completeness of this information.
Any material provided does not have regard to the specific investment objective and financial situation of any person who may receive it. Past performance is not a reliable indicator of future performance. AT provides an execution-only service. Consequently, any person acting on the information provided does so at their own risk.