
Call it what you will, but being in the right place at the right time is a knack that traders can develop over time.
And although I am always thinking about the topics and themes for my next article, sometimes they just write themselves:
This is a case in point
You may recall that in the last article, I highlighted what I thought were opportunities in the S&P 500 Energy sector, and one of the stocks I mentioned was oil services group Haliburton HALUS.
As I was writing the article, Haliburton announced a new joint venture and traded up higher by +4.00%
However, that was just the start as Halliburton picked up upgrades from RBC and HSBC and went on to finish Tuesday’s (21-10-25) session up by +11.58%, and then added a further +4.24% the following day.
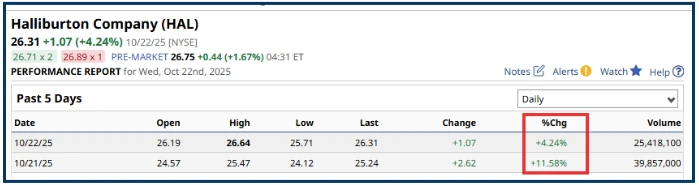
Source:Barchart.com
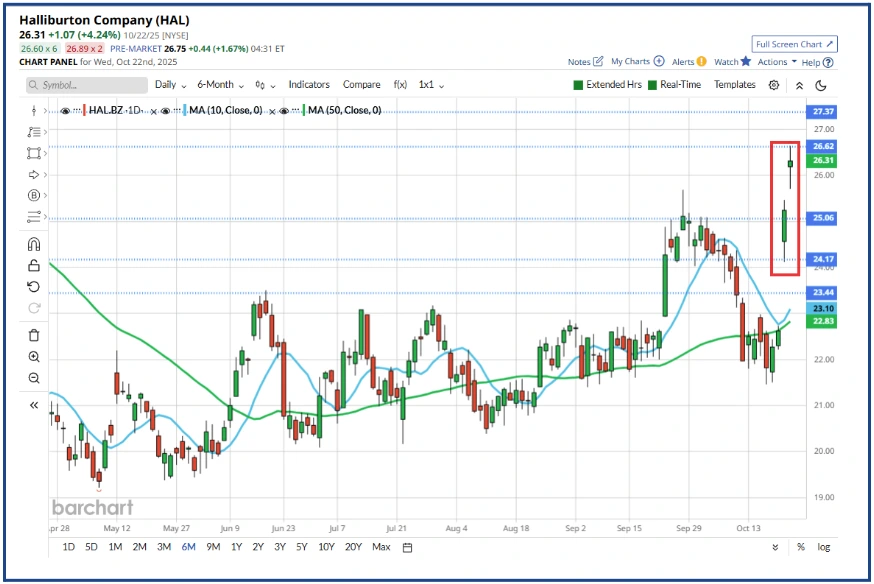
Halliburton gapped higher twice in a row.
Source:Barchart.com
Since then, President Trump has sanctioned Russian oil companies over the country's ongoing conflict with Ukraine.
And in the premarket on Thursday morning, UK time, HAL US is up another +2.0%. So all in, the best part of +18.0% in gains.
Even if we strip the +4.0% in Tuesday's pre market there was still as much as +14.0% up for grabs in those three sessions.
HAL US Short-term/hourly chart
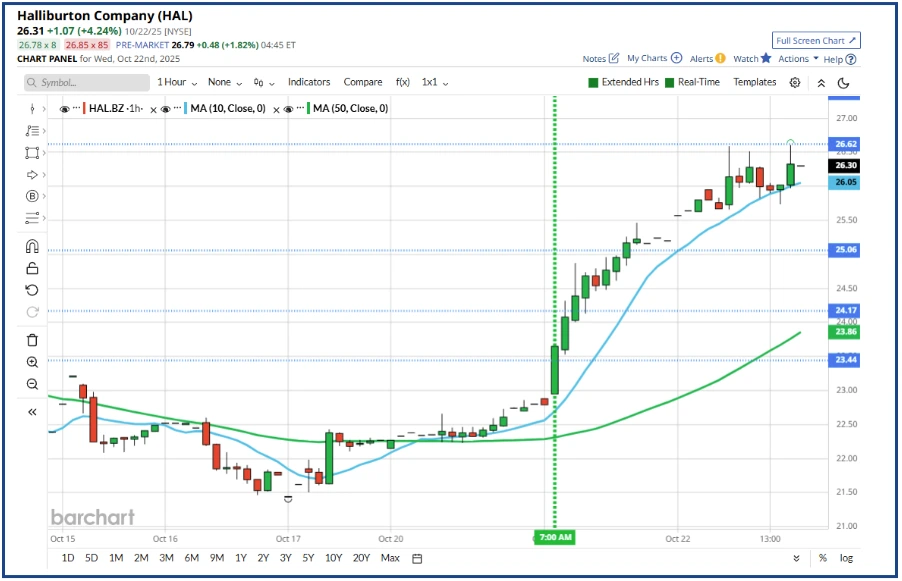
Source:Barchart.com
I am going to call that a success, although my overall contention about high beta stocks hasn't been completely proven by any means.
However, being right for the wrong reasons is acceptable, as long as you understand what’s gone on.
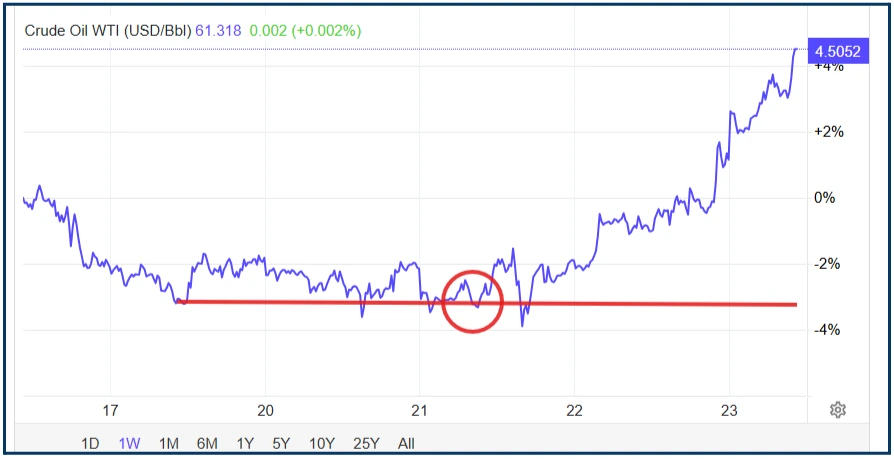
And of course we also saw an +8.0% swing in the price of Crude oil as well ........
Source:Trading Economics
The opportunity in Haliburton came about because of research and recognition
Research into the S&P 500 Energy sector and recognition that the “stars were aligning” for a rally in oil and oil stocks.
They say that you’ve got to be in it to win it, and we were certainly in the right ballpark on that occasion.
Reading the signals
Learning to recognise signals from the markets and crafting those into a narrative comes with experience and can be a process of trial and error.
However, you should become adept at this over time. As long as you learn from your mistakes and correct/improve your process.
Which is what successful traders do continuously.
Here is another example of how recognising clues, creates a credible narrative and a trading opportunity
Back on the morning of 10/10/2025, I shared the following comments with members of my Idea Factory chat group:
“I can barely bring myself to mention this but Nokia is looking interesting again”
I phrased it like this because Nokia had developed a reputation for disappointment.
I also shared the following charts, which showed that Nokia stock was testing on a long-term downtrend line, and had recently posted a bullish MA crossover. And had then gone on to gap up, a few weeks later.
None of which was a concrete reason to get long of the stock, in itself. However in combination, those things suggested, that Nokia was ready for a bigger bounce, given the right catalysts, and a swing in sentiment.
Nokia charts
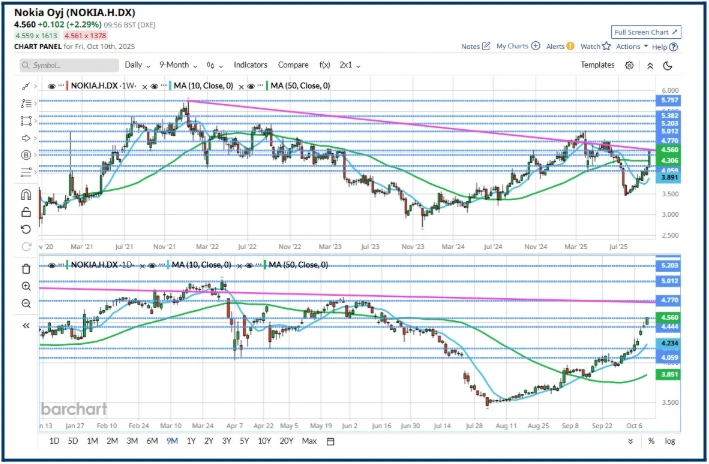
Source:Barchart.com
On 14/10/25, we saw this headline:
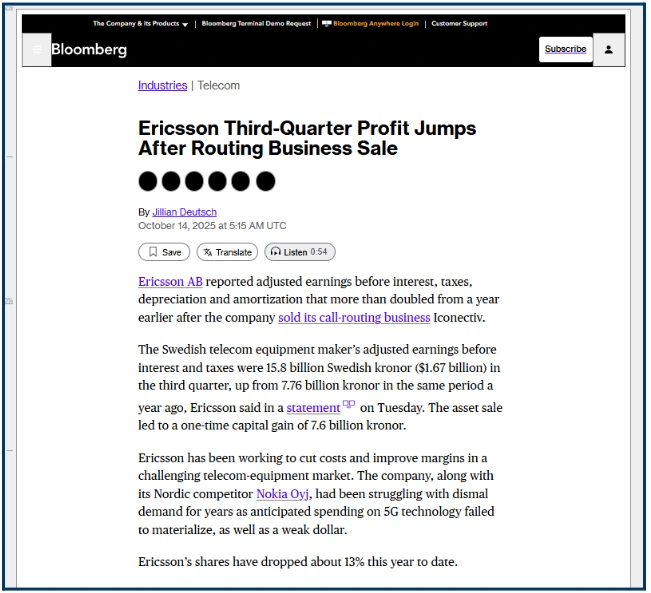
Source:Bloomberg
As you can see below, good news from that sector peer sent the Nokia share price upward.
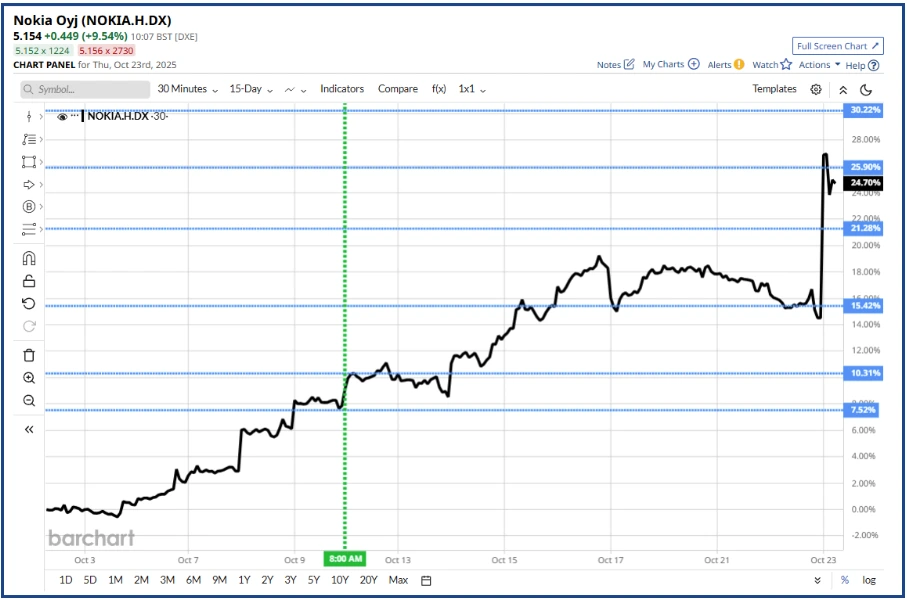
Though the stock lost some momentum on 17/10/25 and moved largely sideways until this morning (23/10/25) when Nokia released its own Q3 earnings.
Reuters said this about those numbers:
“Nokia reported a third-quarter profit which was ahead of market expectations on Thursday, driven by strong optical and cloud demand, including AI-focused data centre sales following its Infinera acquisition.”
Nokia traded up by more than +10.0% on that news before falling back slightly.
That meant that overall, the stock had added +19.0%, since I first highlighted/spotted the opportunity. Which is denoted by the green dashed, green vertical line in the chart below.
Nokia short term line chart
Source:Barchart.com
This example highlights another key facet in successful trading, which is keeping an open mind, or if you prefer being pragmatic not dogmatic.
I have a natural bias against the Nokia share price, based on its history over the last 5 or even 10 years.
However, I was prepared to put that to one side, and let the market speak to me. Which was clearly the right thing to do.
I have said it before but I am a great believer in “What If Thinking” and by that I mean finding trade opportunities and set-ups, whose charts are full of potential.
And then thinking about the type of catalysts that could realise that and turn the latent potential energyin the chart, into dynamic kinetic energy in the stock price.
That approach won’t work with flights of fancy of course. But if you stay grounded, look for opportunities where the odds are stacked in your favour, and the consider what’s (realistically) possible, I think you will be pleasantly surprised.
The information provided does not constitute investment research. The material has not been prepared in accordance with the legal requirements designed to promote the independence of investment research and as such is to be considered to be a marketing communication.
All information has been prepared by ActivTrades (“AT”). The information does not contain a record of AT’s prices, or an offer of or solicitation for a transaction in any financial instrument. No representation or warranty is given as to the accuracy or completeness of this information.
Any material provided does not have regard to the specific investment objective and financial situation of any person who may receive it. Past performance is not a reliable indicator of future performance. AT provides an execution-only service. Consequently, any person acting on the information provided does so at their own risk. Forecasts are not guarantees. Rates may change. Political risk is unpredictable. Central bank actions may vary. Platforms’ tools do not guarantee success.