
Back in April i shared this chart on one of the trading discords that I contribute to, saying that:
“Tesla (TSLA US) was now making some bullish noises”.
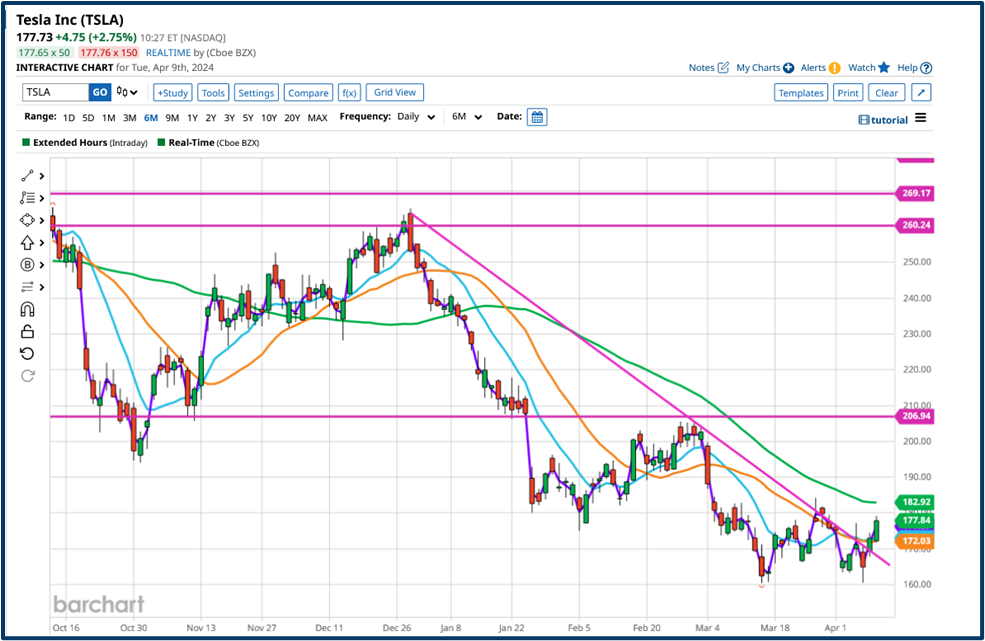
Source: barchart.com
A couple of months later, on June 26th, to be precise, I shared this chart in the same chat saying “Tesla was making some upside noises again.”
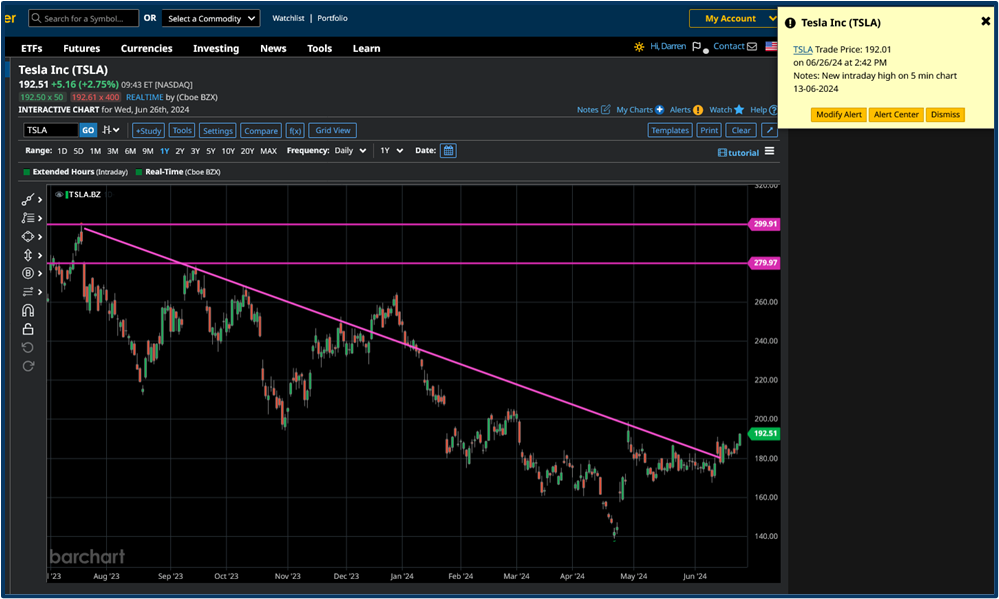
Source: barchart.com
We can see what happened next, in the table below, which shows us the price action in Tesla from June 25th up until the close of play on July 2nd.
The stock moved up for 6 days in row, culminating in a +10.00% move higher on the July 2nd.
High low open close data TSLA US
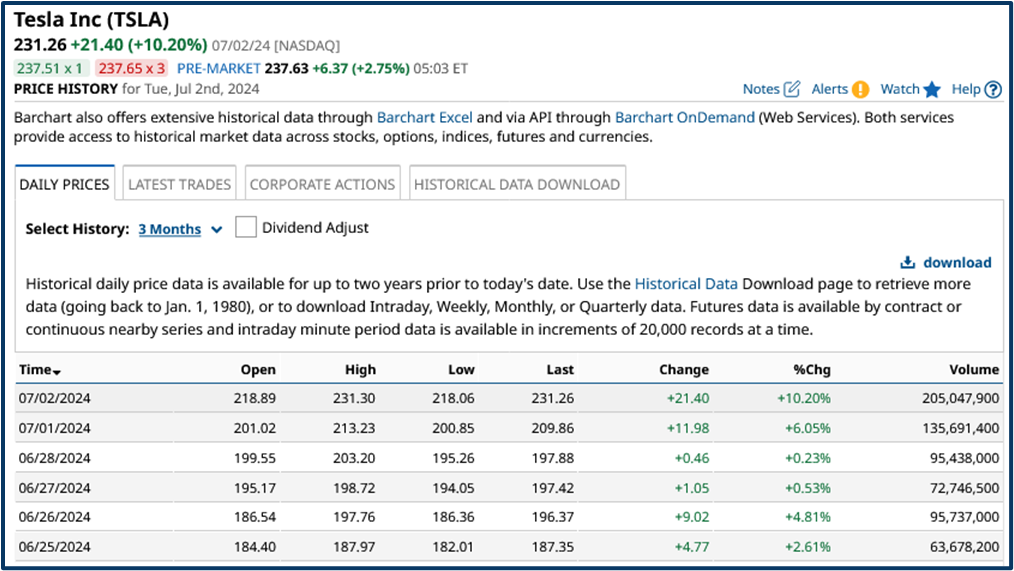
Source: barchart.com
Why was Tesla on my list of stocks to watch?
One obvious reason was it membership of the Magnificent Seven, the group of stocks that have been leadsing US markets higher throught 2024.
However, Tesla stood out for the wrong reasons because it was the only one of the seven stocks that was down over the year to date.
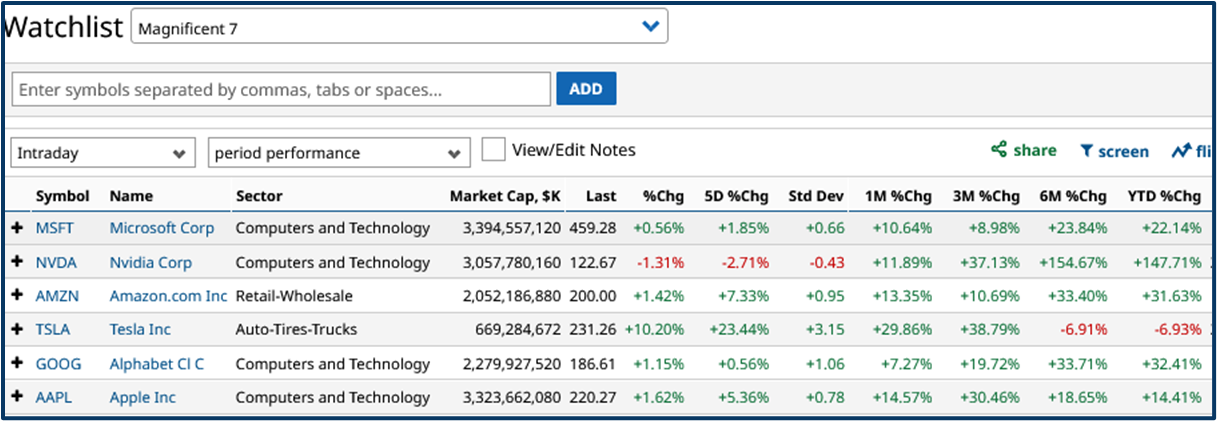
Source: barchart.com
In fact if we look at this chart, which plots the percentage change in Tesla in black, against that seen in the S&P 500, in blue, over the last year. We get a sense of just how much Tesla had underperformed .
The S&P was up by +25.0% in that time, whilst Tesla had lost a smidgen over- 15.70%.
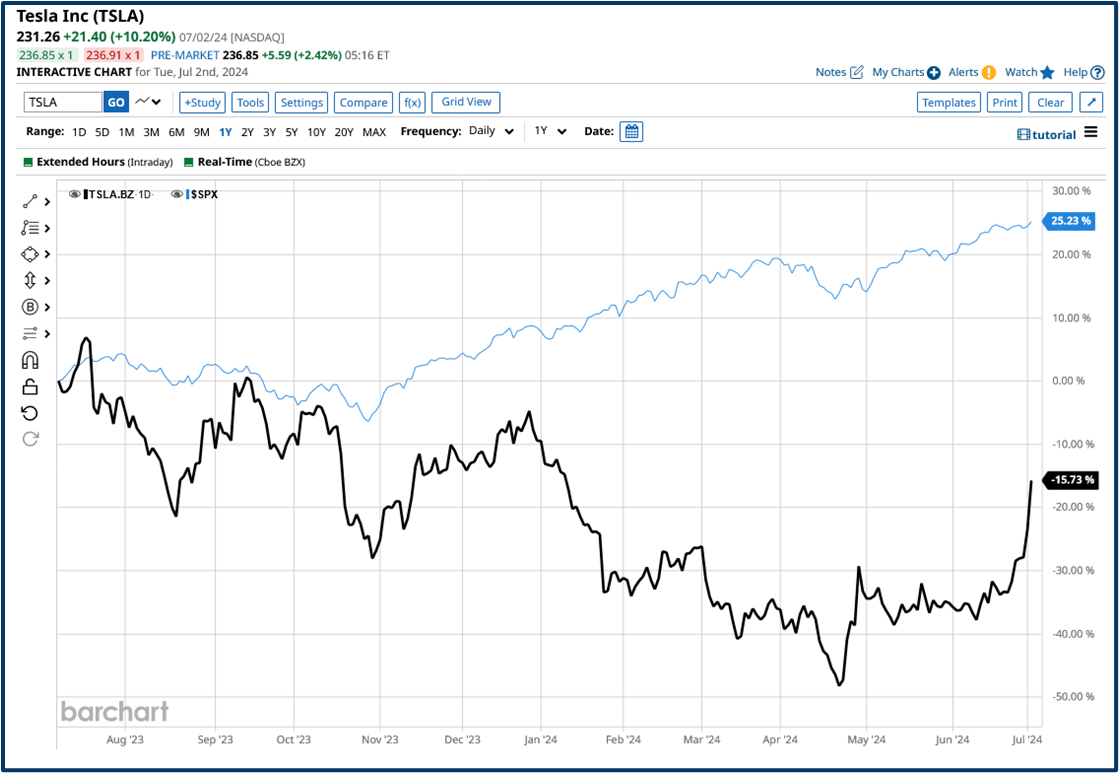
Source: barchart.com
Mining for opportunities
In mid June I actually went looking for underperforming stocks, and specifically underperformers within the technology heavy Nasdaq 100 index.
More specifically still I looked for stocks which had a negative performance year to date vs the wider market.
I started with this chart, that plotted the ytd performance of the Nasdaq 100 stocks (versus the wider US market) against their current RSI 14 readings.
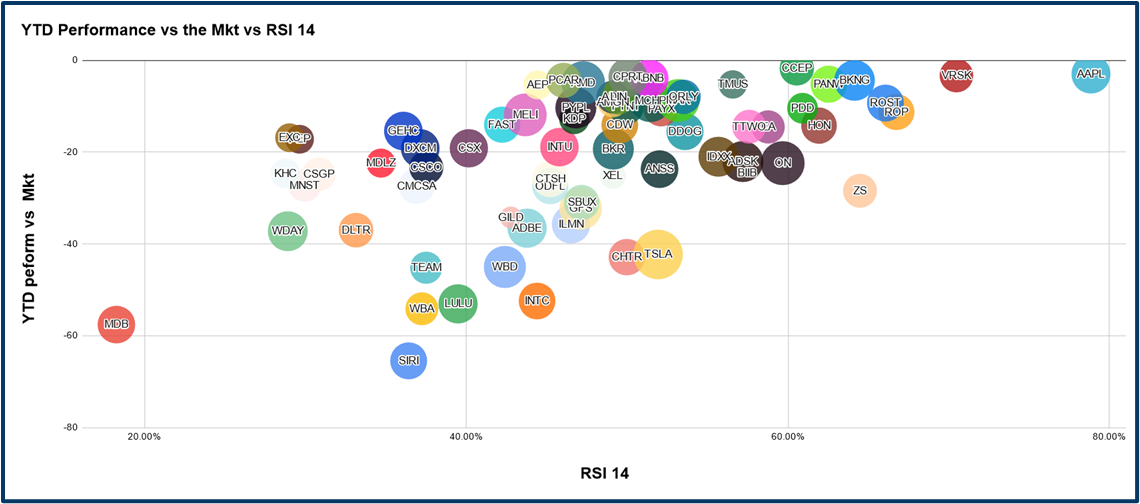
Source: Darren Sinden, Google Sheets
I then drew this second chart to show the year to date performance versus the wider market, compared to the stocks one month percentage changes.
I also sized the bubbles by the number of new highs, each stock had posted over the last three months.
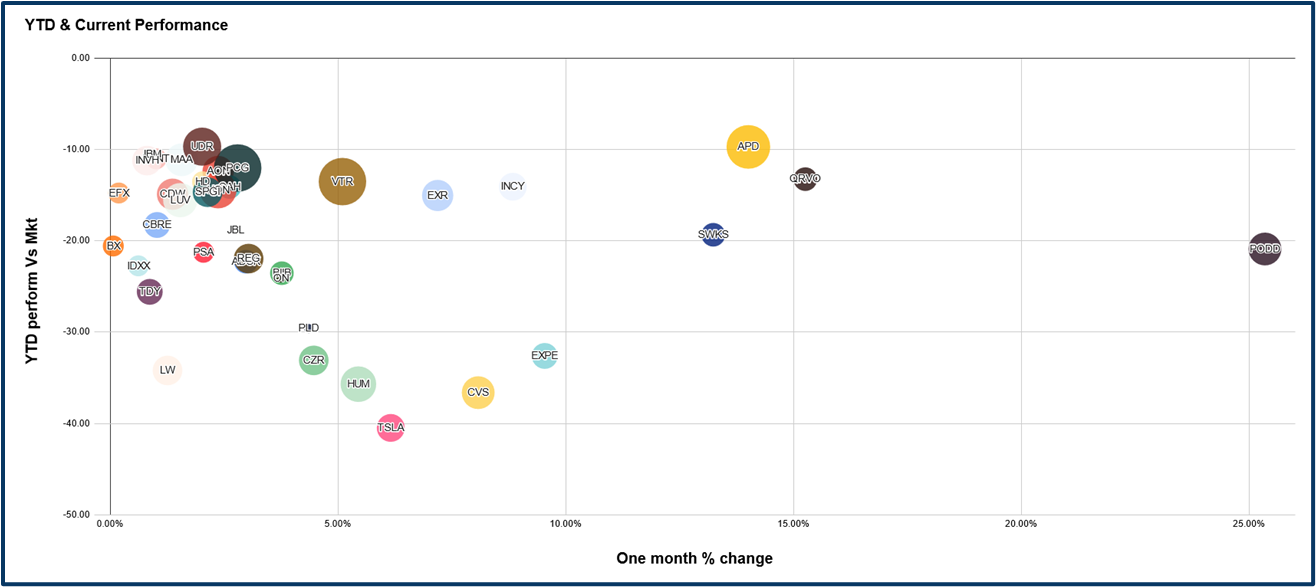
Source: Darren Sinden, Google Sheets
I like to use bubble charts in my screens because I find that using them you can quickly spot outliers, trends and relationships within the data.
The ones too watch
Eventually I settled on the following tickers:
ADSK AON APD BIIB BX CAH CBRE CDW CVS CZR EFX EXPE EXR FTNT HD HON HUM IBM IDXX INCY INVH JBL LUV LW MAA ON PCG PLD PODD PSA QRVO REG SPGI SWKS TDY TSLA UDR VTR
I created a watchlist of these names, which you can see in the table below. The table has been ranked by the one month percentage change - descending.
As we might expect Tesla is the leader. However, there are numerous other stocks with decent double digit gains in that period too.
Note as well that the majority of stocks in the list were up over the month.
Nasdaq 100 underperformers as of June 14 2024
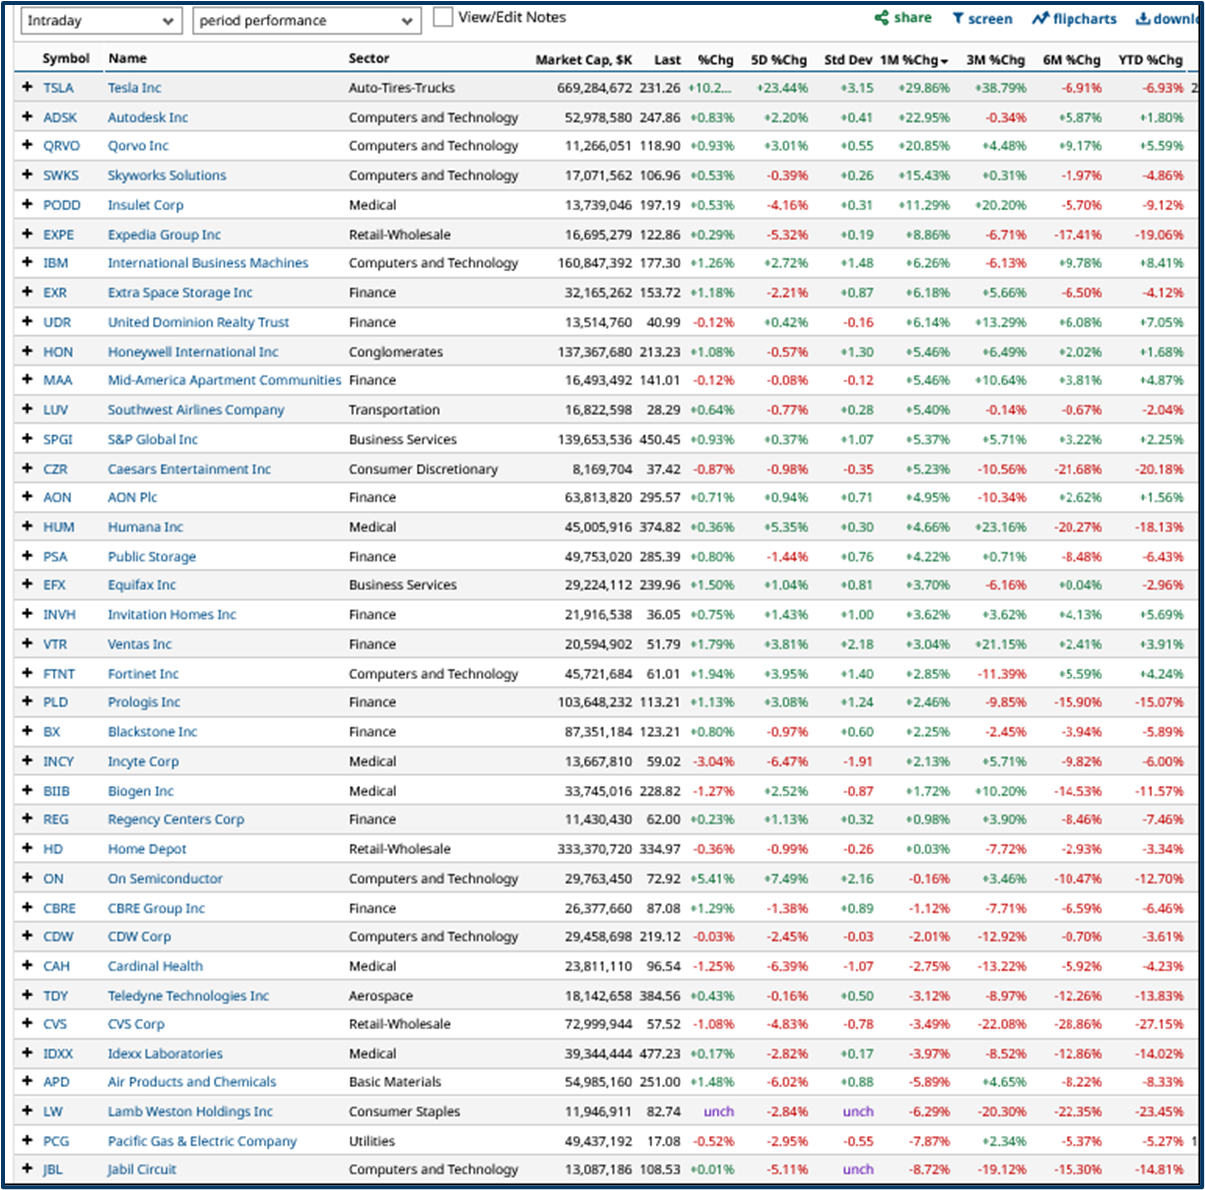
Source: barchart.com
Free at the point of use
What I am trying to illustrate here is how it's possible to screen the market for opportunities.
In this case, stocks which had underperformed, and which therefore had the potential to play catch up, or revert to the mean - the average performance of the wider market.
Creating a watchlist of tickers provided a way in.
And then it was just a case of waiting and watching the price action to identify which stocks had the most momentum.
What's more all of the tools I used to do this (Barchart.com and Google Sheets) are available for free.
You just need to invest a bit of time and now how, then be patient and wait for the opportunties to present themselves to you.
The information provided does not constitute investment research. The material has not been prepared in accordance with the legal requirements designed to promote the independence of investment research and as such is to be considered to be a marketing communication.
All information has been prepared by ActivTrades (“AT”). The information does not contain a record of AT’s prices, or an offer of or solicitation for a transaction in any financial instrument. No representation or warranty is given as to the accuracy or completeness of this information.
Any material provided does not have regard to the specific investment objective and financial situation of any person who may receive it. Past performance is not a reliable indicator of future performance. AT provides an execution-only service. Consequently, any person acting on the information provided does so at their own risk.