
Being able to quickly take the temperature of the market is a really useful skill for a trader to develop.
And one of the best ways to do this, is to use visualisations that’s based on the premise that a picture speaks a thousand words.
The table below is a perfect example of this, capturing, as it does, a snapshot of the majority of the US equities market by capitalisation, revenues and sectors.
The main point of interest here for me is the slider on the right hand side of the table, which shows the daily price range, with the vertical bar, on the slider, indicating the current, or last price, and its position within the day's range.
By looking down the sector list, we can quickly see who was outperforming, who was underperforming, and whether it was buyers or sellers, who had the upper hand on the day.
For example, in this snapshot we can see that top performing sectors (as of the close on 27/02/2026) included Healthcare, Energy and Consumer Staples.
However, if we look further down the list, we find that the Consumer Discretionary and Industrials sectors also finished the day strongly . Both finished very close to the day's high. (Though not among the top performers).
Whilst InformationTechnology was down on the day, and finished very close to the days low point, as well.

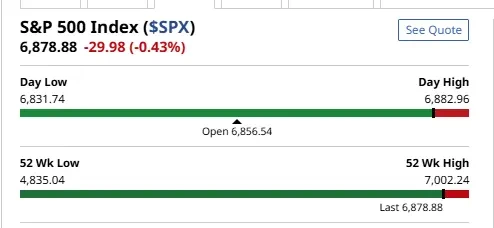
Despite this, the overall tone for the S&P 500 index on the day was positive.
And it was also part of the overwhelmingly bullish 52 week trend in the index.
Though recent events could change that.
We can apply a similar approach to individual stocks as well
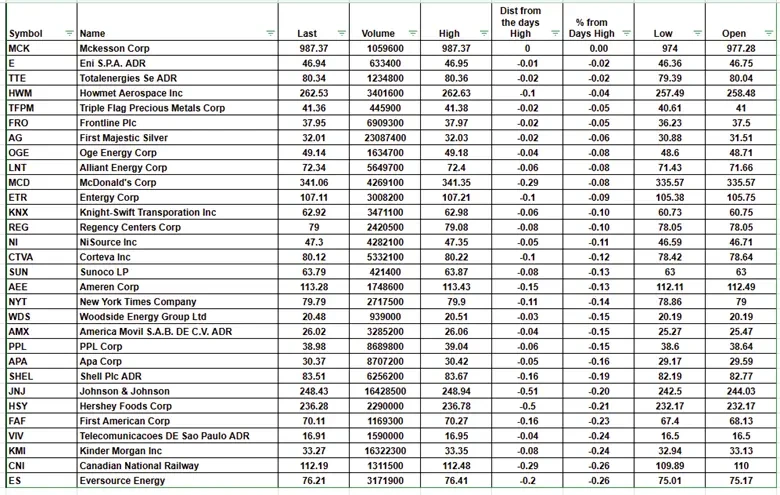
The next table contains a selection of stocks that posted new 52 week highs, on Friday 27-02-2026.
These are all stocks that had positive price action on the last day of February.
However, to paraphrase Geroge Orwell, in Animal Farm:
“All stocks were bullish, but some stocks were more bullish than others”
In this instance I have added a couple of columns to the table, that allow us to highlight those stocks which were the “most bullish” on the day.
And I am determining that, by comparing how the stocks closed, relative to their high price on the day.
The thinking being, that the closer they were to the high, at the end of the day, the more bullish they were.
Of course, there are some potential pitfalls to this approach.
For example, a stock could have had an awful day, in outright price performance terms, but still have finished at, or close to, the day's high.
However, the “new 52-week high” filter in the table should allow us to avoid those instances.
Large Cap US-listed stocks with new 52-week highs as of the close 27/02/2026
Source:Barchart.com
Creating a table like this, (which I did in Barchart.com), means we can instantly start quantifying the performance of the stocks within it.
Mckesson Corp MCK US, are top of this table, when it's ranked by the % from the day's high column (in descending order)
MCK US closed on the high of the day.
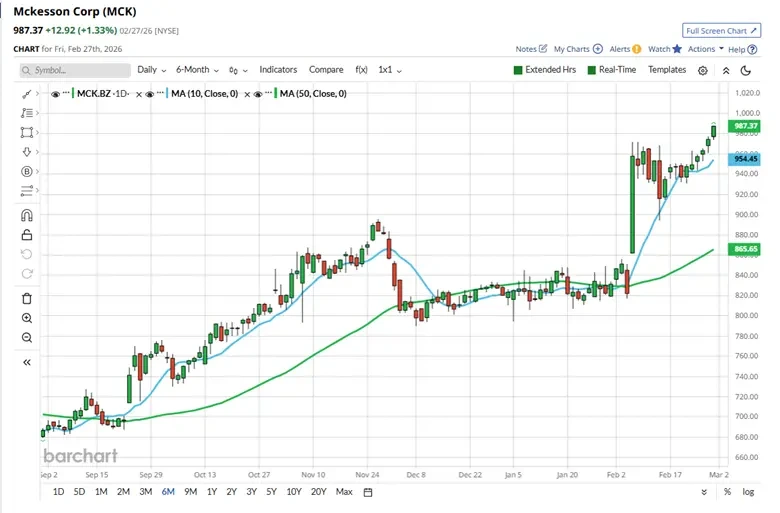
The MCK chart below shows strong, and continuing upside momentum, in the share price.
In fact if we look further back on the chart, we find that McKesson has been moving higher since late September.
And of course, Healthcare was the best performing sector on Friday 27-02-2026.
Could the defensive properties of stocks in this sector become a positive in times of increasing macroeconomic and geopolitical uncertainty?
Source:Barchart.com
What if we used the sliders to try to identify the worst-performing sectors and stocks this year?
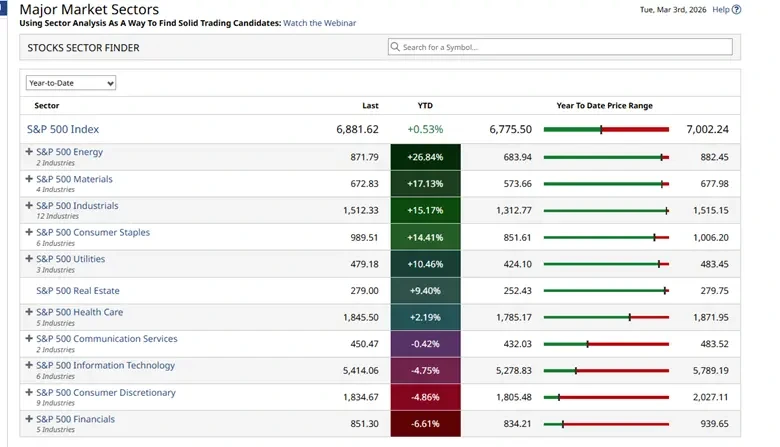
Here is a table of S&P 500 sector performance year to date.
From the slider standpoint, both Consumer Discretionary and Financials are towards the bottom end of their year to date ranges.
However, Financials edge it, because they are down -6.61% year to date as of the close on 02-03-2026, versus Consumer Discretionary's -4.86% fall.
Source:Barchart.com
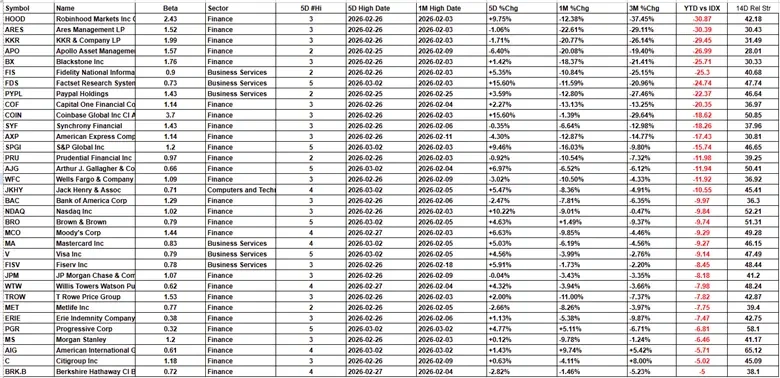
Having identified the most negative sector in the timeframe under observation, let’s drill down to look for the worst performing stocks in the sector year to date.
The table below is ranked by the performance of the stocks relative to the S&P 500 index year to date .The column is highlighted in red.
We can see that Robinhood HOOD has underperformed the S&P 500 by almost -31.0% in 2026
Whilst alternative asset managers occupy the next four spaces down, with readings ranging from -30.39% to -25.71%.
Source:Barchart.com /Darren Sinden
Big Business
Some of the biggest financial businesses in America are in this list, including the world's biggest bank JP Morgan alongside card and payment processors like American Express, Visa and Mastercard.
The companies in this list have been affected by a range of factors, including asset performance (crypto, private creditweakness), potential competition from AI, and, more recently, uncertainty around US tariffs and the new conflict in the Middle East.
It's true to say that very few of these names are looking oversold on RSI 14 ie reading 30 or less (the far right-hand column),
And, so they could have further to fall, and in the current climate, you probably wouldn’t argue against that.
And yet, when you read that revenues in a mature business like Visa, V US, have grown +83.10% over the last 5-years, whilst its earnings have risen by +127.50%, and the dividend by +96.70%. It’s tempting to think that there is value out there.
What we think is not what’s important, however!
What is important is how many other people think that.
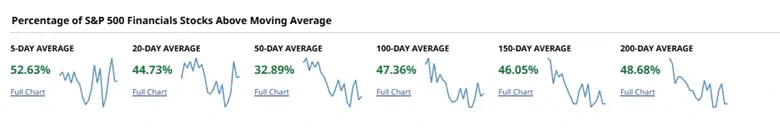
When we see a swing from very bearish sentiment towards mildly bullish sentiment, is when it gets interesting for traders.
And that’s when our market thermometers (like those below) become very useful indeed.
Source:Barchart.com
The information provided does not constitute investment research. The material has not been prepared in accordance with the legal requirements designed to promote the independence of investment research and as such is to be considered to be a marketing communication.
All information has been prepared by ActivTrades (“AT”). The information does not contain a record of AT’s prices, or an offer of or solicitation for a transaction in any financial instrument. No representation or warranty is given as to the accuracy or completeness of this information.
Any material provided does not have regard to the specific investment objective and financial situation of any person who may receive it. Past performance is not a reliable indicator of future performance. AT provides an execution-only service. Consequently, any person acting on the information provided does so at their own risk. Forecasts are not guarantees. Rates may change. Political risk is unpredictable. Central bank actions may vary. Platforms’ tools do not guarantee success.