
As regular readers will be aware I try to take a systematic approach to the equity markets. I like to look at data in order to identify outliers and emerging trends.
I pay particular attention to the price action because I believe that it reveals a great deal about what's going on in a particular stock or sector. And perhaps more importantly where that might lead us too in future.
Over the last couple of years, I have used the tools available to me to highlight short to medium-term momentum trading opportunities and if I say so myself it’s been a fruitful exercise.
Data-driven
What's pleasing about it is that the market does most of the work for me. Of course, i still have to interpret the data and the signals it generates. But like anything that you do repetitively after a while it becomes second nature as you grow increasingly familiar with the process.
Of course as we have discussed before there is so much information and data out there you need to be very selective, and set some clear ground rules to avoid being overwhelmed.
So I focus on the basics: High Low Open Close, and Volume, alongside select moving averages, their interaction with each other, and the underlying price.
Through a glass clearly
Here is a perfect example of what I am interested in the chart below is that of Corning Inc GLW US a specialist glass, optics and communications business.
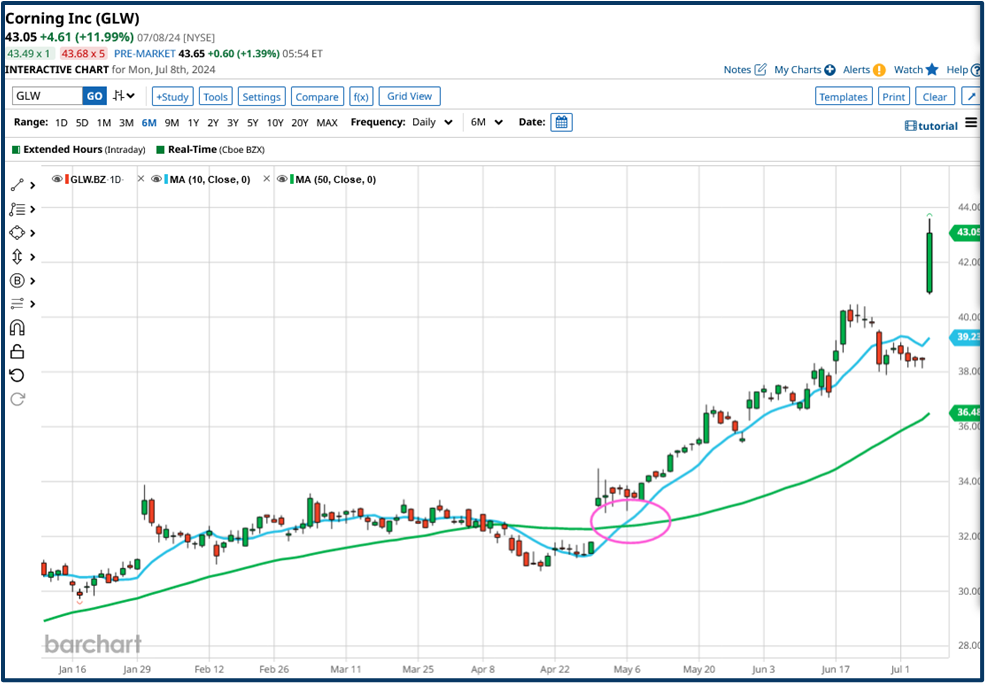
Source: Barchart.com
In the latter part of April, Corning's price moved higher and above the 50-day moving average, shown in green. A few days later in early May, the faster-moving 10-day MA line crossed up through the slower-moving 50-day line. That move effectively initiated an uptrend in the stock, which carried on through late June.
The move ran out of steam as June turned into July. However, the price was supported at $38.00 which suggested that it ”didnt want to go lower”.
That feeling was justified on July 8th when Corning raised its guidance for Q2 2024. The price jumped higher once more and finished the day up by +11.99%,
Taking the total gains in the stock, since the close on April 29th to 37.60% according to data from Barchart.com.
Corning delivered those gains because it had upside momentum.
We can see that in the price action and we can visualise it in a chart like this one.
Which shows the percentage of up-days in the stock compared to down-days over the last three months of trading.
Percentage of Up-days and Down-days in Corning over the prior three months
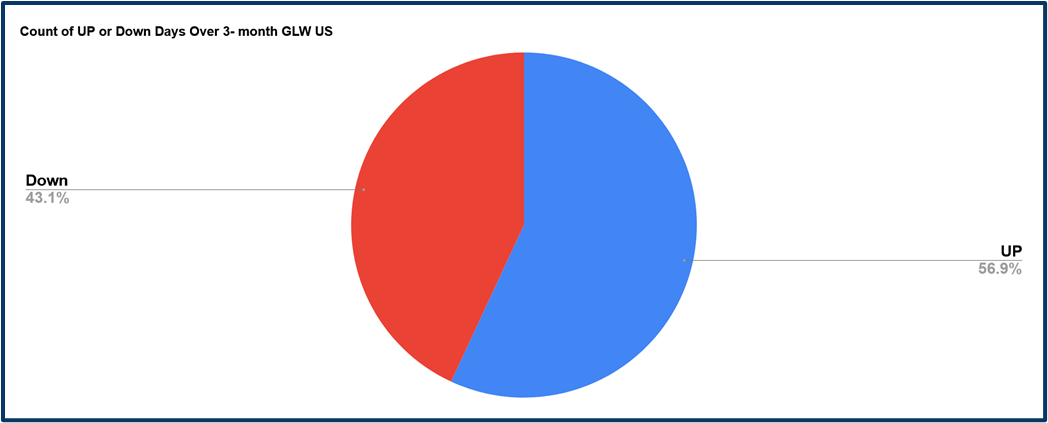
Source: Barchart.com/ Darren Sinden
There is a clear bias to the upside with almost 57.0% of trading days finishing with a positive return.
What's more the average daily return in Corning's stock price, over that period, was +0.47%.
In simple terms we had more buyers than sellers, more up days than down, and steady, positive average daily returns to boot.
Why has my approach been so successful in uncovering trading opportunities like Corning?
I think there are several reasons:
Firstly I have ben doing this along time, so I should know what I am looking for and what boxes I want to see ticked when I’m looking for trading opportunities and set ups.
Secondly I am not trying to force anything. I am letting the market and the price action show me what's happening. There can be some days where nothing catches my eye, and others when there are half a dozen or more opportunities worth noting and investigating.
Thirdly I am not trying to pick tops or bottoms. Instead, I look for potential trend changes backed up or confirmed by signals. Like the MA cross in the Corning chart above.
Consistency in the price action and the introduction of a catalyst can unlock the potential energy in a set-up and turn it into kinetic energy, or price change.
The fourth reason that allows my approach to work is the market background. I have often said that traders need to be adaptable and pragmatic if they want to take advantage of the conditions they find themselves trading under.
And so I view every day as a learning curve, whilst at the same time remembering what's gone before.
Factor returns
The table below shows us the returns generated by selected investment factors or styles, among the S&P 500 constituents. The returns cover the very short-term (one month) right out to the long-term (15-years).
Returns generated by selected investment factors or styles in the S&P 500
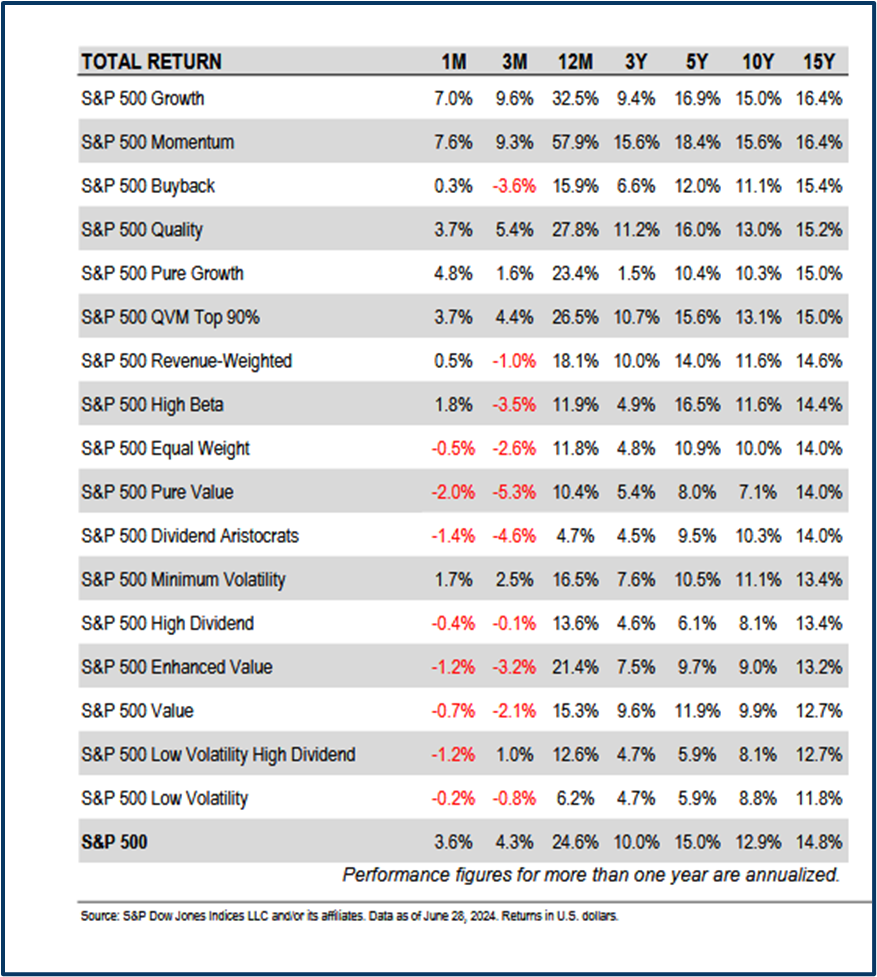
Source: S&P Dow Jones Indices
Over the last 12-months one factor or style stands head and shoulders above the others, as far as returns are concerned.
And that is momentum, which has notched up returns of +57.90% in the last year.
That compares to just +24.60% for the S&P 500 index and +32.50% for the next best performer, growth.
Now to be fair the way that S&P Dow Jones captures and measures momentum is very different from the shorter term momentum opportunities that my systems are designed to surface.
However, they are all part of the same ecosystem and until momentum starts to underperform I will continue as I am.
And even if it does start to underperform, that may just create more opportunities to trade on the downside going forward.
The information provided does not constitute investment research. The material has not been prepared in accordance with the legal requirements designed to promote the independence of investment research and as such is to be considered to be a marketing communication.
All information has been prepared by ActivTrades (“AT”). The information does not contain a record of AT’s prices, or an offer of or solicitation for a transaction in any financial instrument. No representation or warranty is given as to the accuracy or completeness of this information.
Any material provided does not have regard to the specific investment objective and financial situation of any person who may receive it. Past performance is not a reliable indicator of future performance. AT provides an execution-only service. Consequently, any person acting on the information provided does so at their own risk.