
In the first part of this short series of articles, we looked at which US sectors and industries had dramatically underperformed the S&P 500 over 2026 to date.
You will likely recall that the laggards were sectors exposed to AI, and more specifically to the new generation of Agentic AI agents and tools.
The impact of which has been rattling the market for several days.
For example, as here, in the stock price of UK listed financial advisor St James‘s Place STJ LN, which fell by -13.39% on Tuesday, as US Fintech Altruist debuted a new platform that allows advisers to create bespoke tax and financial planning for clients, much more efficiently.
Is the St James‘s Place moat being drained?
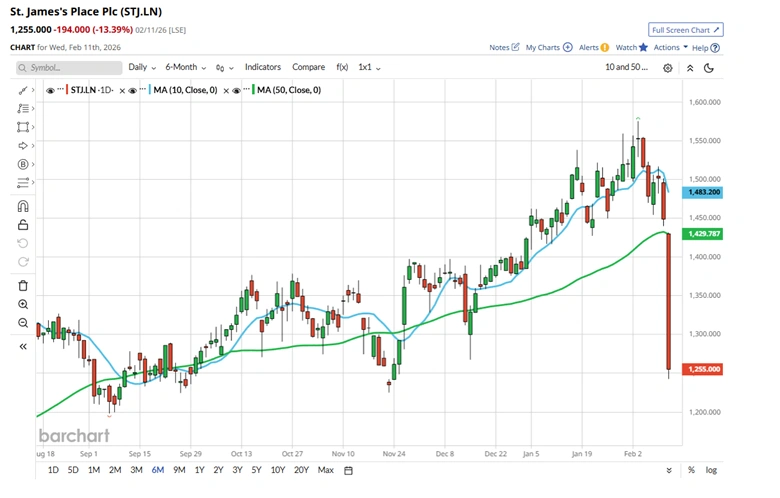
Source:Barchart.com
Going Up
Of course, not every sector or industry has underperformed year to date, in fact, many of them have beaten the S&P 500 over the first 6 weeks of the year.
What stood out straight away, when I compiled a table of these outperformers, is just how slanted the constituents are towards the “old economy”, and away from the new.
We have talked about fashions and trends establish themselves in the equity markets before, and this is a perfect example of that behaviour.
US Sectors and Industries that are outperforming the S&P 500 index Year to date as of 11-02-2026
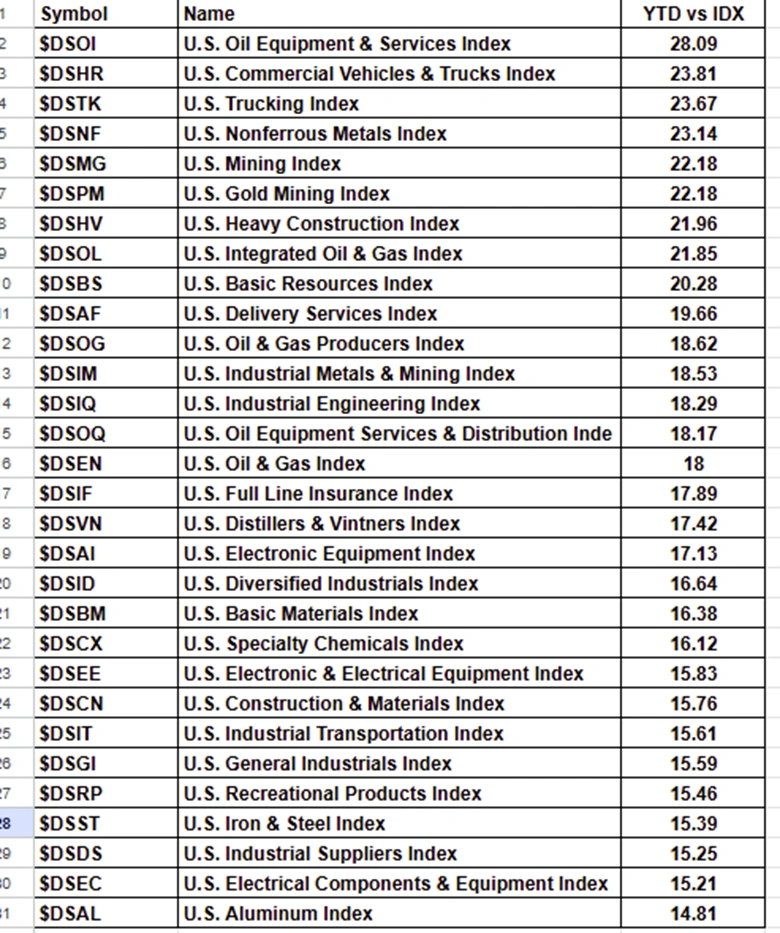
Source:Barchart.com
Material World
In the chart below we see the S&P 500 Materials sector, compared to the S&P 500 index year to date.
The sector has rallied by more than +17.0%, whilst the S&P 500 itself is up by just +1.40%.
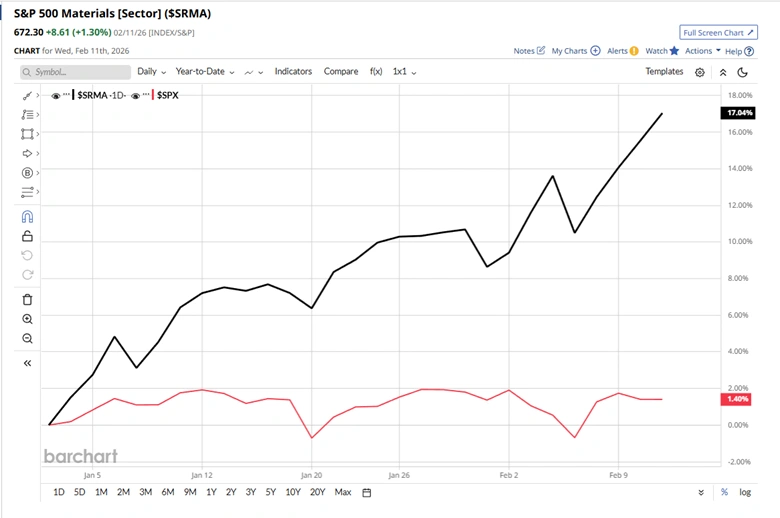
Source:Barchart.com
This collection of charts is even more emphatic, showing, as it does, the percentage of stocks within the S&P 500 materials sector that are trading above key moving averages.
If you were looking for a lightning rod for market breadth, you may have found it.
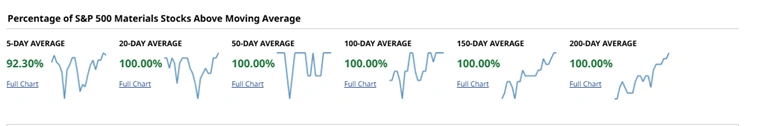
Source:Barchart.com
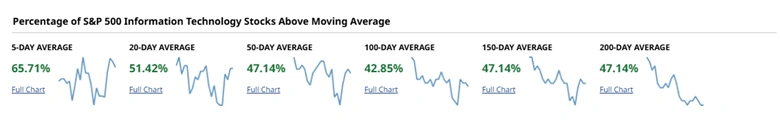
Now compare and contrast those images to the same charts for the Information Technology sector.
Need I say more?
Source:Barchart.com
You might have noticed that the bottom item in the table of outperforming sectors and industries above, is the US Aluminium index.
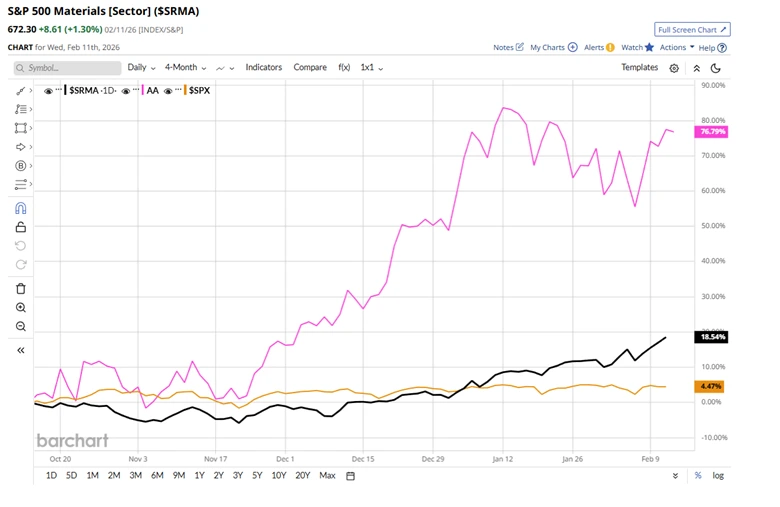
The Americans and the British have never been able to agree on the pronunciation of the name of one of the world's most abundant metals. However, what we can agree on is the extraordinary performance of one of its major constituents, Alcoa AA US, over the last 4-months.
Here is Alcoa, in pink compared to the S&P 500 Materials sector index in black, and the S&P 500 Index in orange.
I have drawn this chart over 4-months to emphasise the fact that the gains, both in Alcoa and the wider materials sector, didn't just happen overnight. Rather, they were part of an ongoing trend.
Trends that we had an opportunity to jump on, if we knew where to look, and what we were looking for.
Source:Barchart.com
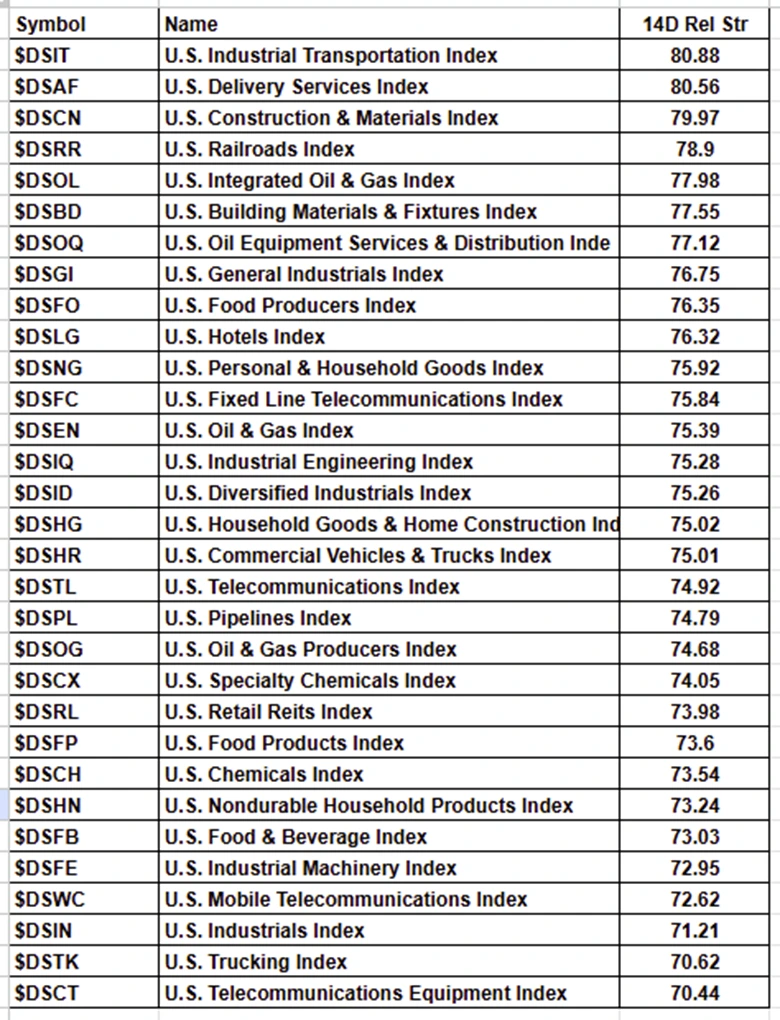
When it comes to looking for future trends among US sectors and Industries one thing we might want to consider is those areas that are looking short term “overbought.”
And with that in mind here is a table that shows items that have an overbought RSI 14 reading.
Just because something has an RSI 14 reading above 70, doesn’t mean it’s overbought or can’t go higher
What a high RSI 14 reading does tell us however, is that near term, trading in the instrument has become “overextended”, relative to the prior 14 day period. Providing us with an excuse to dig a bit deeper, if any were needed.
Sectors and industries with an RSI 14 reading greater than or equal to 70.0
Source:Barchart.com
To compliment the table above, here is a table of S&P 500 stocks with an RSI 14 of 78 or greater.
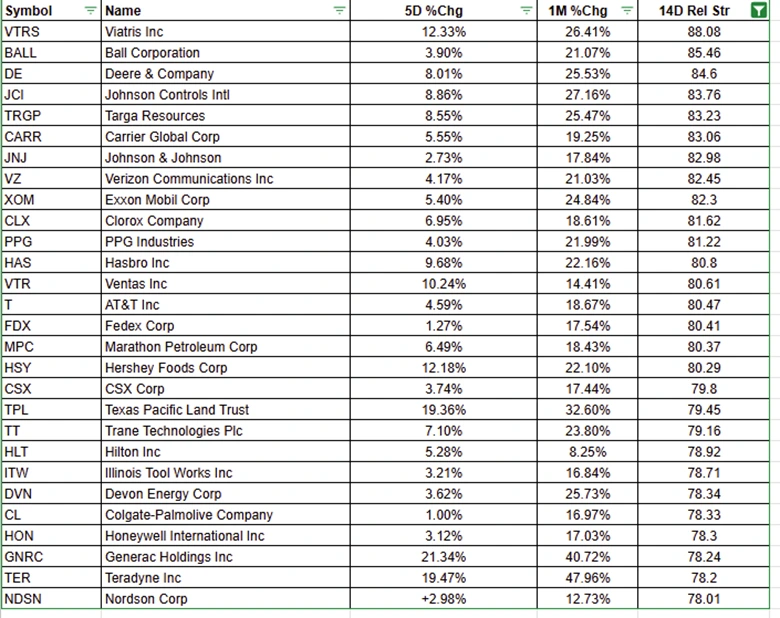
Source:Barchart.com
How might we use this type of table?
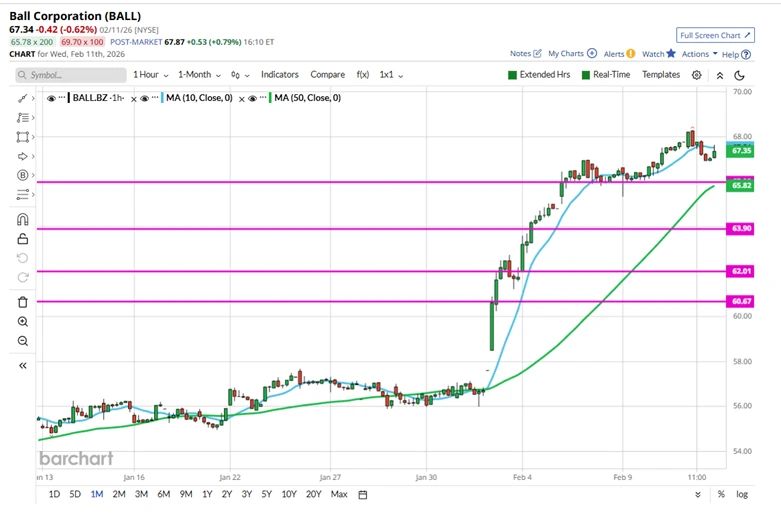
Well, how about looking at a chart, for example, this one of Ball Corporation, drawn over a monthly time frame.
Have you spotted the horizontal support around, and just below $66.0?
Could a move through here open the door to $63.90 and or $62.01 I wonder?
Source:Barchart.com
Part of a trader's job is to look at the market through as many different lenses and from as many different angles as possible, in order to establish which one provides the best view or prospect from which to trade.
Being curious and retesting your previous assumptions should help you avoid getting stale or complacent because it's in those dead zones that losses and bad behaviour can occur.
The market is just like the ocean in that its’ beautiful to look at and exhilarating to be on, but part of then thrill comes from knowing that it's quite happy to capsize our boat (trade) and smash it into the rocks the first chance it gets. Which is why you should never take the ocean, or the market for granted.
The information provided does not constitute investment research. The material has not been prepared in accordance with the legal requirements designed to promote the independence of investment research and as such is to be considered to be a marketing communication.
All information has been prepared by ActivTrades (“AT”). The information does not contain a record of AT’s prices, or an offer of or solicitation for a transaction in any financial instrument. No representation or warranty is given as to the accuracy or completeness of this information.
Any material provided does not have regard to the specific investment objective and financial situation of any person who may receive it. Past performance is not a reliable indicator of future performance. AT provides an execution-only service. Consequently, any person acting on the information provided does so at their own risk. Forecasts are not guarantees. Rates may change. Political risk is unpredictable. Central bank actions may vary. Platforms’ tools do not guarantee success.