
We pick up where we left off last time out and move on to rule number 3.
3) Be pragmatic not dogmatic about the markets
That brings us nicely to rule number three:
It's all very well having a trading plan, indeed it’s essential to have a set of rules that we follow, each time we trade.
However, we also need to acknowledge the sentiments expressed by German Field Marshal, Moltke The Elder, who famously quipped:
“No plan of operations extends with certainty, beyond the first encounter with the enemy's main strength.”
Which these days tends to be shortened to:
“ No plan survives contact with the enemy”
What Marshal Moltke was saying is, that war is a chaotic environment - that even the best-laid plans can’t cope with.
Whilst trading is not a life-and-death environment, like the battlefield. It is still a contest, between you, your fellow traders and the market.
A contest that takes place in a dynamic environment, that's constantly evolving.
That means, that we have to be adaptable too, if, we are not only to survive but to thrive, in that environment.
That doesn't mean that we can throw our trading rules out of the window.
But it does mean that we can't just rigidly stick to them regardless.
We need to be pragmatic and adapt them, to suit the prevailing market conditions.
To help to get into the pragmatic mindset stop worrying about why?
And instead, start focusing on what is and what if.
I often talk about the power of “what if thinking” - a little imagination helps me a great deal when it comes to identifying trade opportunities and set-ups. And what could come next in the price action with the introduction of a suitable catalyst?
I often won’t know what form that catalyst will take, however, that doesn't matter as long as I can identify the path of least resistance in the price action when it emerges.
4) Simple solutions are often the most effective (KISS) remove complexity
Trading is complex we can't pretend otherwise. However we can’t hope to capture that complexity as part of our trading process. There are too many inputs and stimuli, too many data points, too many other participants and just too many variables.
High Frequency Traders, or HFTs often process their trades in microseconds. Timeframes that the human mind can't even perceive or register.
We have to let that wash over us and instead focus on what we can process and interpret, and trust me we will still be left with plenty to get our teeth into.
But don't clutter your charts filling them with ever more indicators, lines and coloured blocks etc.
Instead, remove that complexity and use simple visualisations to tell you the story of the price action.
That story should shout at you from the page or screen.
It should make it completely clear what’s happening and what's going to happen next, and you don’t want your analysis to get in the way of that message. Instead, it should frame it.
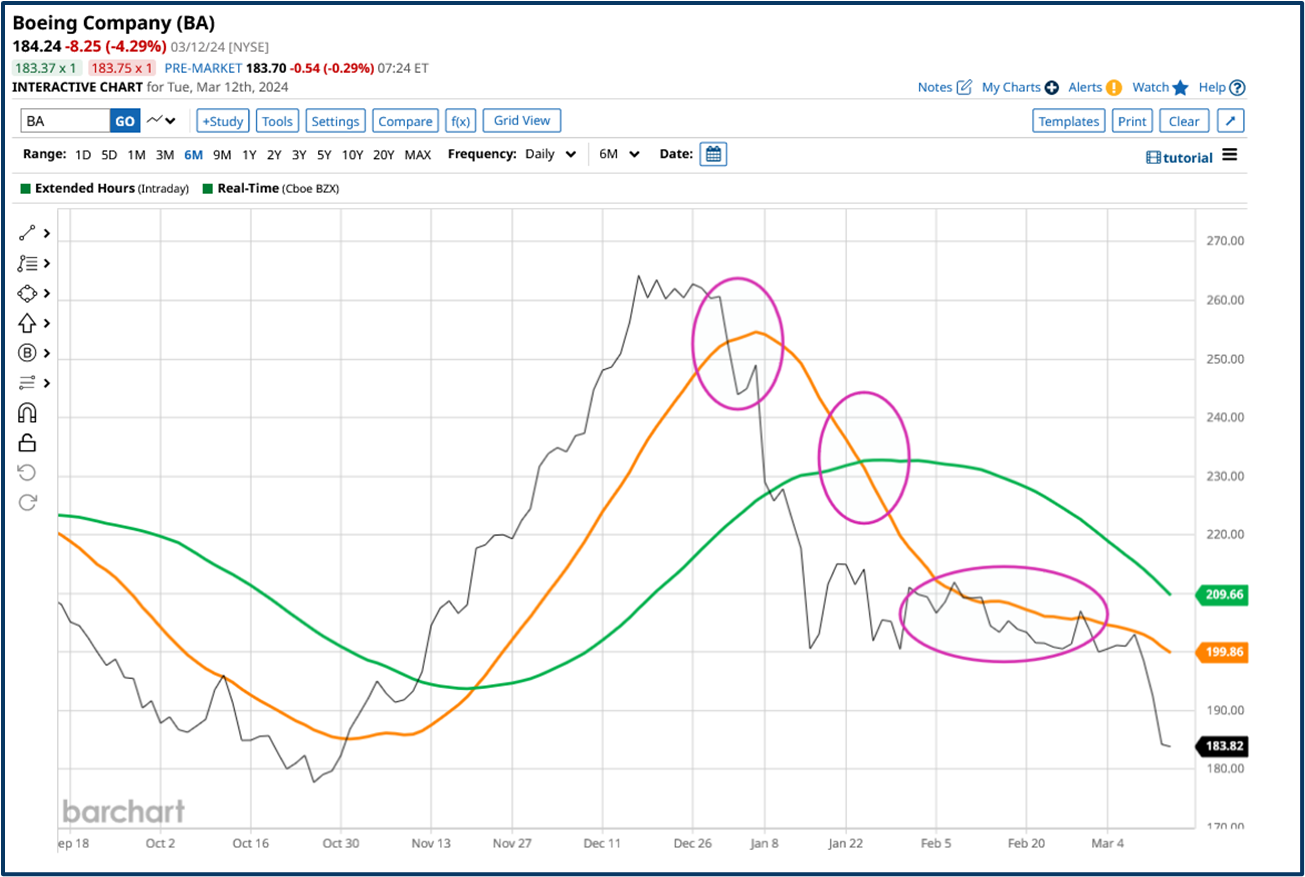
This chart of Boeing is a perfect example of a chart with a clear narrative:
We have three lines- price in black.
The 20 and 50-day moving averages are in orange and green respectively.
The story of the chart and the price action that results is the story of the interplay between those three lines, some of which I have highlighted in the magenta ovals.
Source: Barchart.com
We see the price line cross down through the 20 d MA line - effectively ending the prior uptrend.
It then continues moving lower and down through the 50-day line.
Then, the 20-day line turns lower and crosses down through the 50-day line forming a deadcross.
The 20-day line then takes on the role of resistance to the price line, see the bottom right-hand side of the chart.
There is nothing complicated here, but there is nothing bullish either, as far as the Boeing price action is concerned.
5) Systemize where you can and use data to screen the markets
With so many data points and variables in the market, we need to use data and technology to our advantage. Screening the markets systematically looking for opportunities and outliers can help to cut out much of the background noise found on any given day in the markets
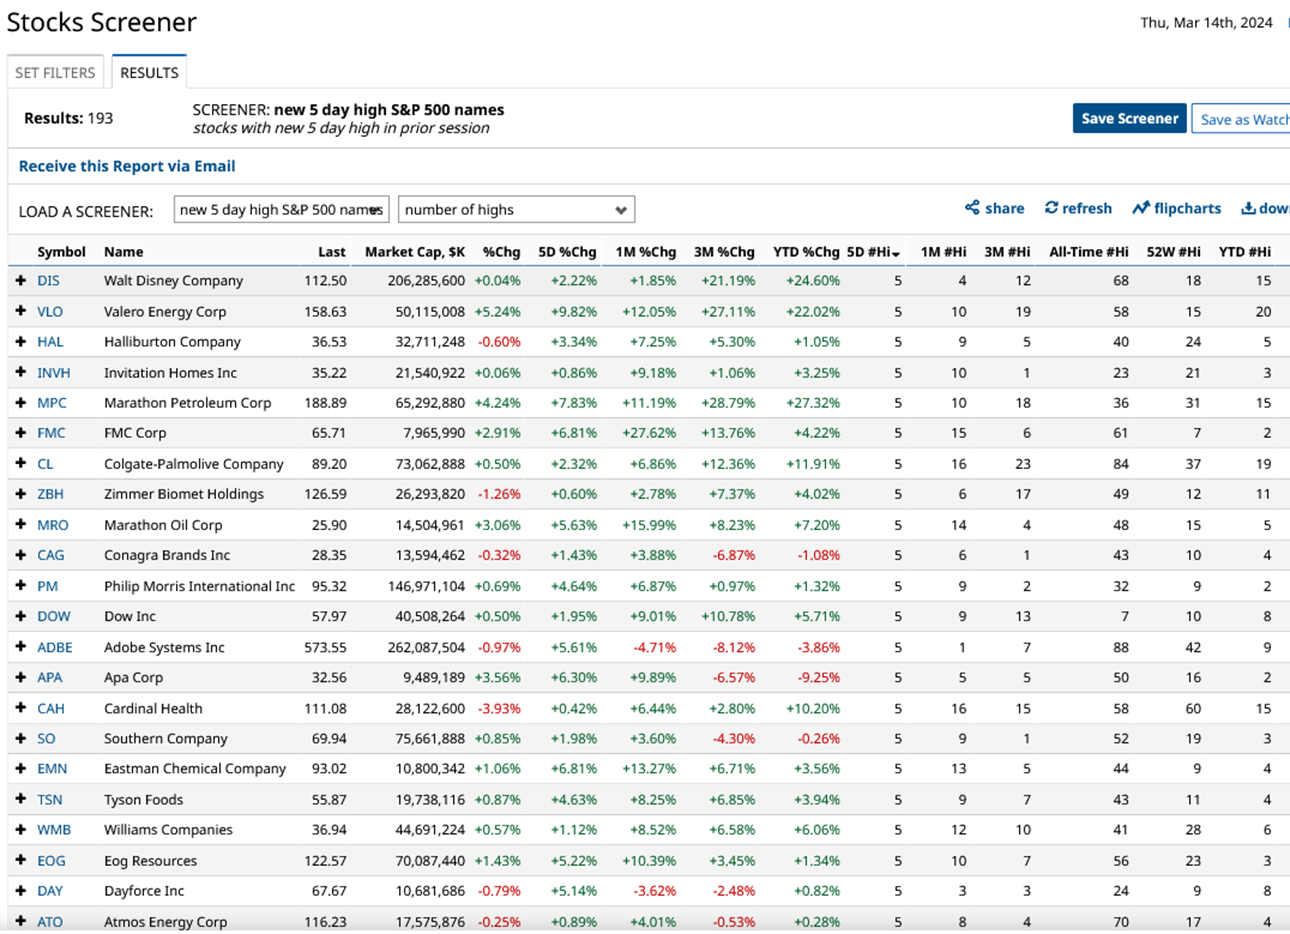
Here is a screener I run on barchart.com, it looks for S&P 500 stocks which have posted a new 5-day high.
I have taken the results and shown them in a view that tracks the number of period highs made by each stock.
And in this instance, I have ranked the table by the number of 5-day highs posted, in descending order.
Source: Barchart.com
Among the stocks posting a new 5-day high on 13-03-2024, a number had posted 5 consecutive new 5-day highs and they are displayed above.
Let's take a look at Walt Disney (DIS US) it’s posted 5 consecutive 5-day highs but had only moved up by +2.22% in that period.
Whereas oil refiner Valero Energy (VLO US) has posted 5 consecutive 5-day highs but moved up +9.82% over the last week so it's fair to say that Valero has had higher short-term momentum than Disney.
But what if we wanted to look at which of the stocks delivered the biggest bang for the buck? I.E. which one moved the most for each new five-day high it posted.
To calculate that we simply divide the 5-day percentage by the number of 5-day highs.
On that basis, Disney delivered a change of +0.44% per new 5-day high whilst Valero delivered +1.96% per new 5-day high.
However, the best performer on this basis, among the stocks that posted new5-day highs on 13/03/2024
Was copper miner Freeport McMoran (FCX US) which returned +3.46% per new 5-day high.
S&P 500 stocks that posted new 5-day highs on 13-03-2024 & had posted at least 4 new 5-day highs.
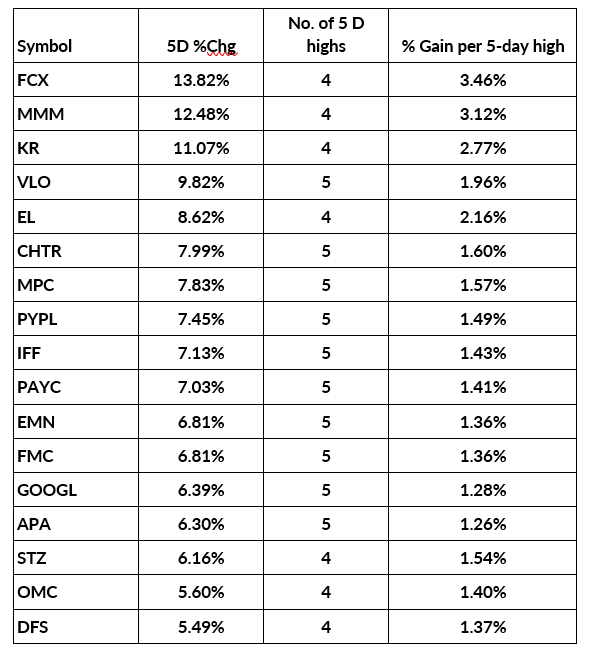
Source: DCS research
By screening the market in this way we can start to get a feel for which stocks tend to make a decent move given the right catalysts and we can get a better feel still if we extend the principal and time frames to say take in one and or three months or year to date time horizons.
All we need to do is experiment with the data, much of which is available for free or for a limited monthly cost, so your only real investment will be your time and effort.
The information provided does not constitute investment research. The material has not been prepared in accordance with the legal requirements designed to promote the independence of investment research and as such is to be considered to be a marketing communication.
All information has been prepared by ActivTrades (“AT”). The information does not contain a record of AT’s prices, or an offer of or solicitation for a transaction in any financial instrument. No representation or warranty is given as to the accuracy or completeness of this information.
Any material provided does not have regard to the specific investment objective and financial situation of any person who may receive it. Past performance is not a reliable indicator of future performance. AT provides an execution-only service. Consequently, any person acting on the information provided does so at their own risk.