
Equity markets have continued to make gains, after US voters elected Donald Trump for the second time in 8 years.
The Nasdaq 100 has added more than +4.00% in the last 10 days, at the time of writing, whilst the S&P 500 Consumer Discretionary sector, has added a whopping +8.90%. Much of which can traced back to the 3+1.0% gain seen In Tesla TSLA.
When the markets are in this sort of mood it's not the time to oppose them. The media has been full of stories about hedge funds who shorted Tesla, that are now licking billion dollar wounds.
However the recent gains in equity markets have the look and feel of knee jerk reaction.
After all Mr Trump hasn't set out substantive or detailed policies. Instead he’s talked about big picture changes that he wants to make, and of course he won't even take up his new post as President of the USA, until January 20th.
So there is plenty of time for things to calm down, and for some year end profit taking to occur, after all it's been a very good year for those who were long of US equities, particularly large caps. as we can see below.
The S&P 500 is up by +25.0% year to date,and if it stays like that, it will finish the year with returns that are approximately three times those seen in an average election year.
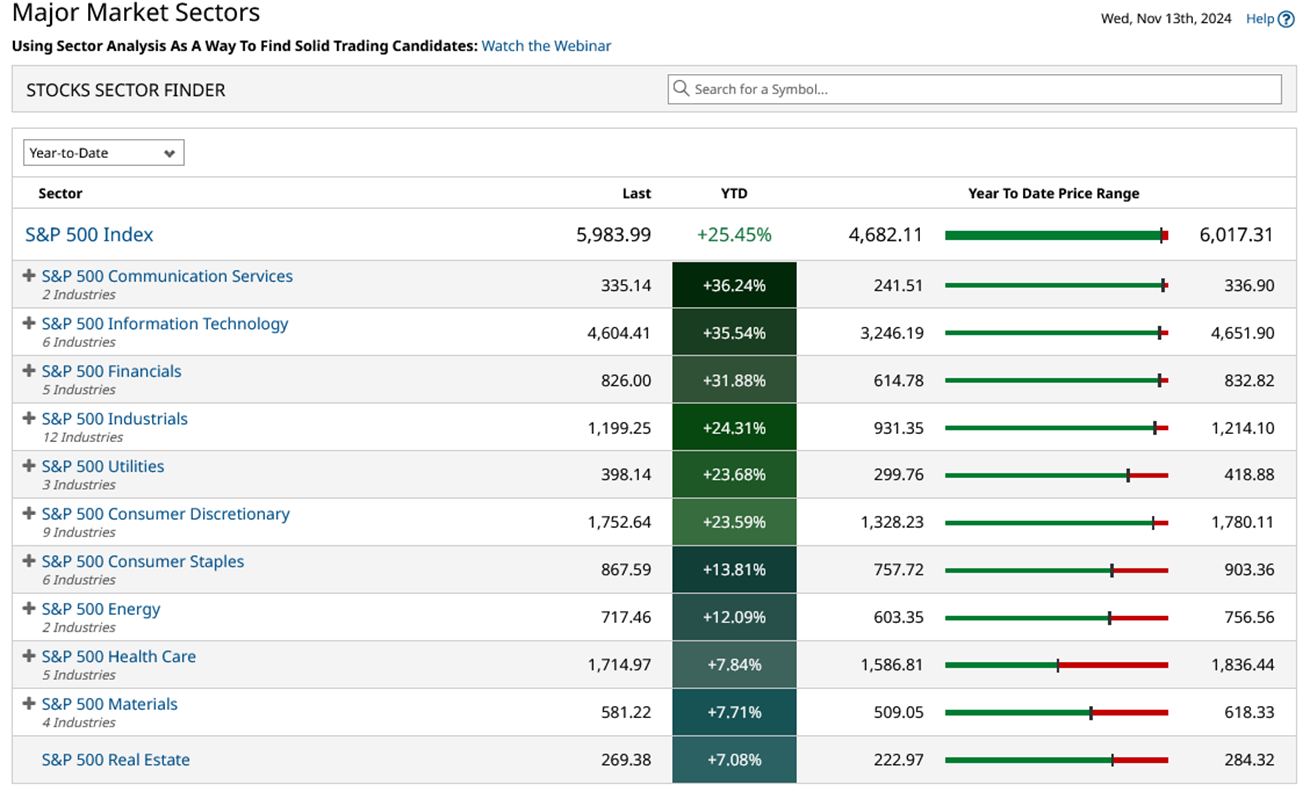
Source: Barchart.com
68 days and counting
January 20th is 68 days away, that's enough time for some doubts to creep in, and for even the most ardent Trump fan to question his decision making. Take for example, the nomination of FOX TV presenter and former soldier Pete Hegseth, as Secretary of Defence.
If there were to be a wobble during this period of transition might that make the top of the markets?
And if that were to be the case could we spot that change in sentiment?
I am not sure that there will be any one signal or indicator, that would call an equity market top, though there are definitely things to watch along the way.
Starting with earnings from Nvidia NVDA, after the close on November 20th.
Nvidia has risen by more than +200.0% year to date, and is the largest US company by market cap.
So what the company reports and how the market receives it matters.
In recent times Nvidia has knocked it out of the park with earnings beats and strong forward guidance.
It's quite likely that it will do so again, however the longer that cycle goes on then the bigger the disappointment is likely to be should the company fall short of increasingly heightened expectations.
The market has a phrase for just this situation and that is “priced for perfection.”
What else might we look at to try and get a handle on sentiment in the US equity markets?
The chart below is a plot of the net number of new one month highs & lows among US stocks.
The number of new highs spiked in Mid July aand plunged sharply in early August.
And has yet to recover convincingly.
And as you can see the indicator is testing back at the downtrend line, that extends from the July peak, and which now coincides with the indicator's 50-day Moving Average.
Breaking below here would take us into negative territory that is the number of new one month lows would be greater than the number of new one month highs being posted.
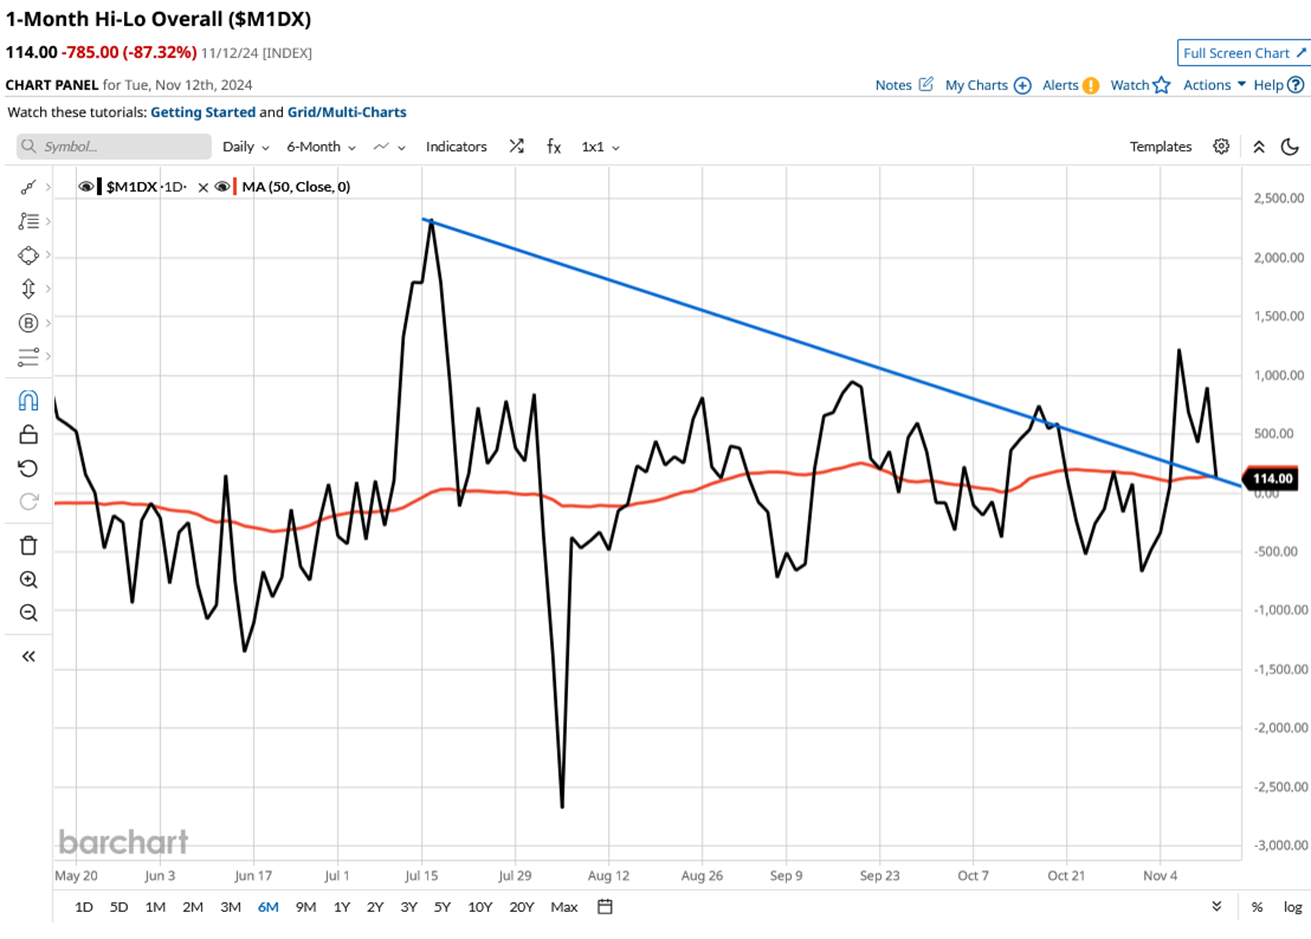
Source: Barchart.com
Uptrends and bull markets are comprised of a progression of higher highs and higher lows and if we are not posting a surplus of new highs, then that says something about sentiment among traders.
Of course not all stocks are created equal, the S&P 500 is a cap weighted index in which the biggest stocks have the biggest influence.
It follows then that sentiment towards the biggest stocks within that index is worth keeping an eye on.
one way to do that, is to track the % of stocks within the S&P 100 (the 100 biggest S&P 500 components), that are trading above key moving averages, and perhaps even more importantly the trends in those MA percentages..
We can see that data below.
Could the recent spike in the 5 and 20-day MA % start to unwind?
After al,l the trends in the 50-day through to 200-day metric’s are downward and haver stayed that way despite the post election rally.
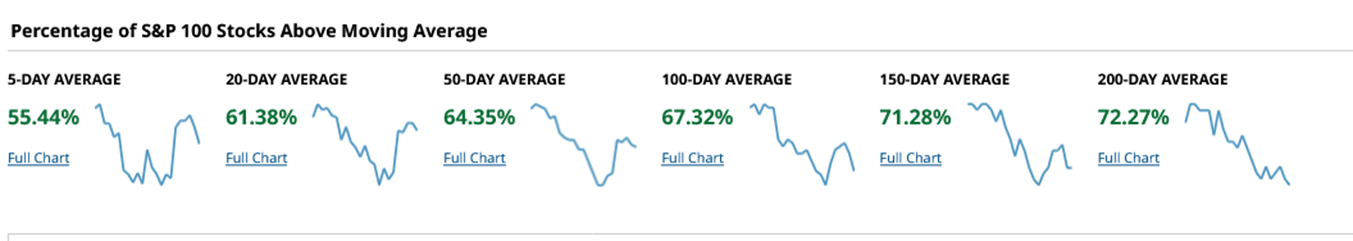
Source: Barchart.com
Gap below
Staying with S&P 100 index I can’t help but notice that there is a gap to fill back below 2800.
Nature abhors a vacuum and so do the markets. If the gap were to be filled in the coming weeks, then 2750 would become an interesting level once more, would it continue to play support? Or could it give way?
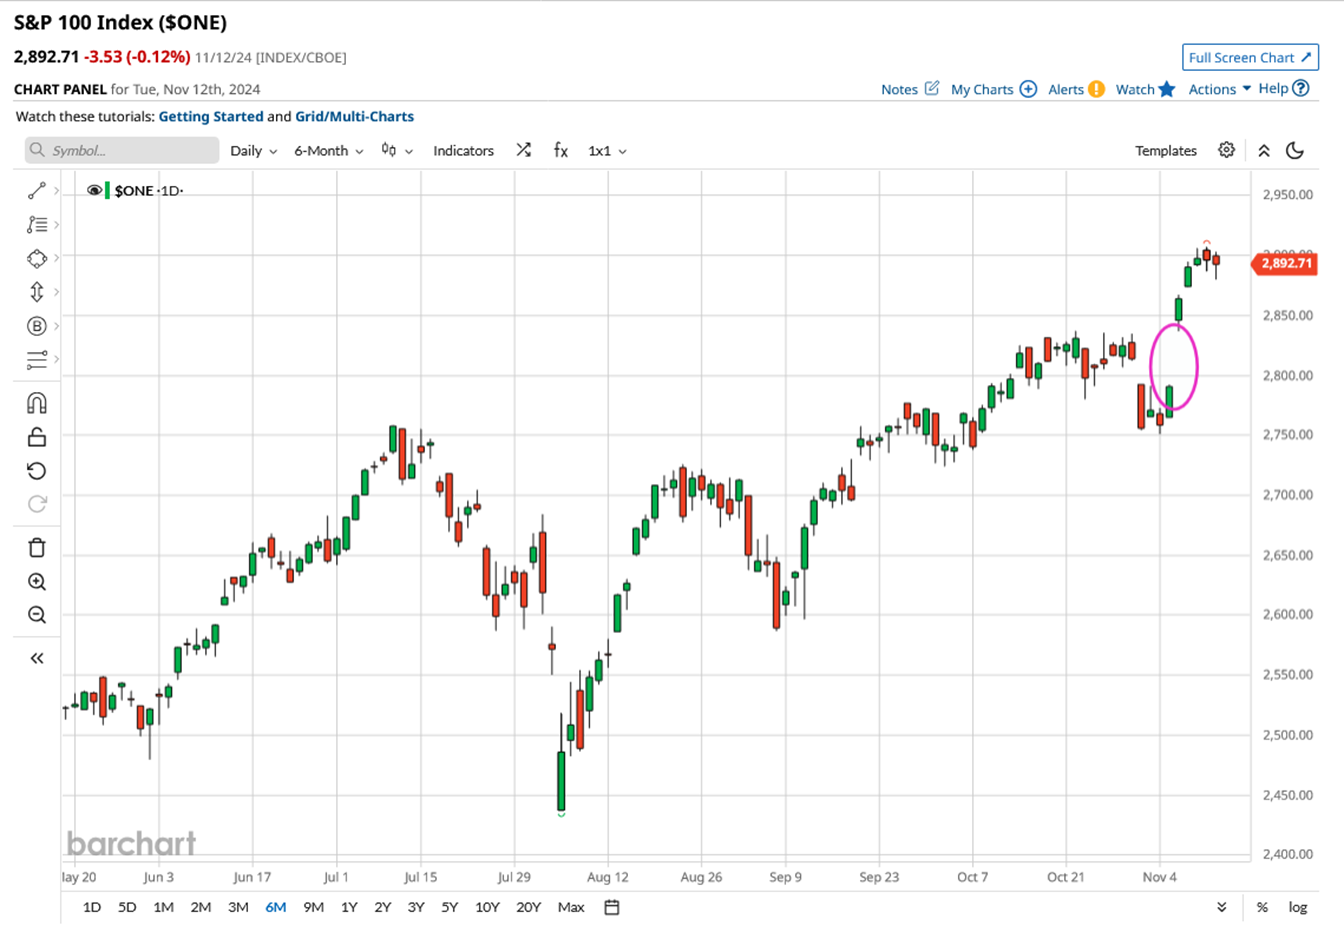
Source: Barchart.com
Another indicator what we should keep a close eye on is the yield on 10-year US Government bonds. The yield acts as a proxy for US Government borrowing costs, however, the rate is also a barometer of market stress and sentiment.
10-Year bond yields have been moving higher, even as US interest rates have been falling and that's unusual.
If 10-year yields keep rising the equity markets might start to question whether the Federal Reserve will continue to cut interest rates, as it did, at its September and November meetings
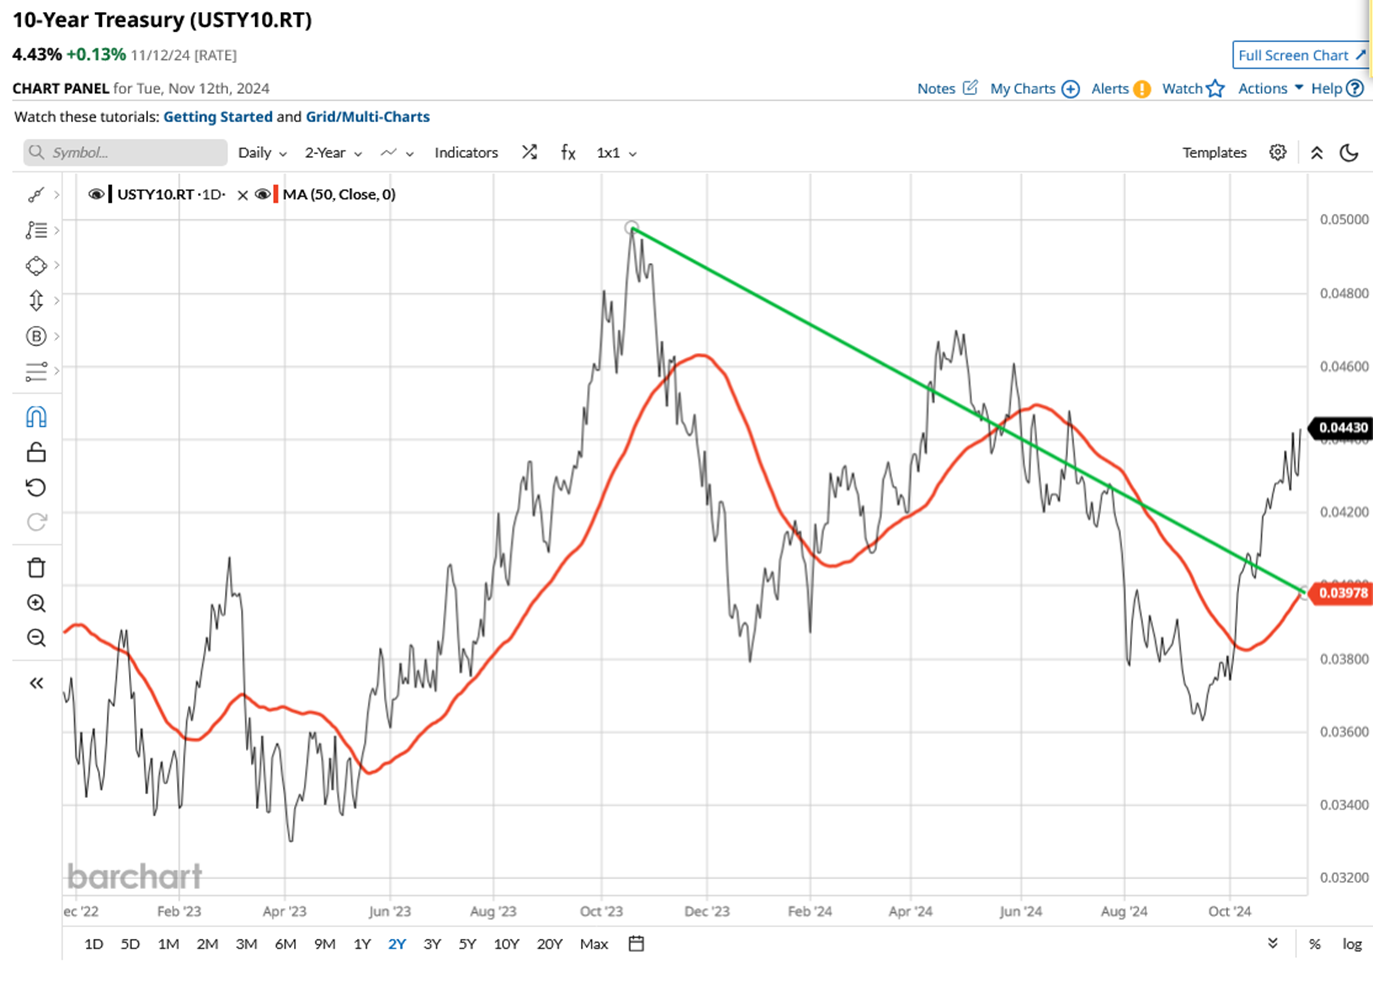
Source: Barchart.com
Last time out Fed Chair Jerome Powell, wouldn't be drawn on what would happen next to US interest rates, so further cuts are not guaranteed.
The prospect of falling US interest has been a major contributor to US equity gains this year, particularly in the second half of 2024.
I recently wrote that “sentiment changes on the margin” and the equity markets view of 10-year yields is just such a location.
This is not an exhaustive list of indicators by any means and ther eis no certainty that markets will top out.
But remember that as traders we always need to be on the look out for trend changes, and any clues that they may be in the offing.
As regular readers may be aware I try to use as many free, or low cost data tools, as possible and all of the indicators used in this article can be tracked at Barchart.com for free.
The information provided does not constitute investment research. The material has not been prepared in accordance with the legal requirements designed to promote the independence of investment research and as such is to be considered to be a marketing communication.
All information has been prepared by ActivTrades (“AT”). The information does not contain a record of AT’s prices, or an offer of or solicitation for a transaction in any financial instrument. No representation or warranty is given as to the accuracy or completeness of this information.
Any material provided does not have regard to the specific investment objective and financial situation of any person who may receive it. Past performance is not a reliable indicator of future performance. AT provides an execution-only service. Consequently, any person acting on the information provided does so at their own risk.