
As we head towards year end it's a natural time for traders to take stock of what happened over the last 12 months, as well as to look forward, thinking about what the New Year might bring, and where trading opportunities might be found in 2026.
I have set out a few of my own suggestions below
US equity indices have had a mixed 2025. The S&P 500 is up +14.28% year to date, as I type. A positive return but no more than what the long term averages suggest, the index should achieve, which infers that 2020 and 2022 were exceptions, rather than a new normal see below.
S&P 500 Historical Annual Returns
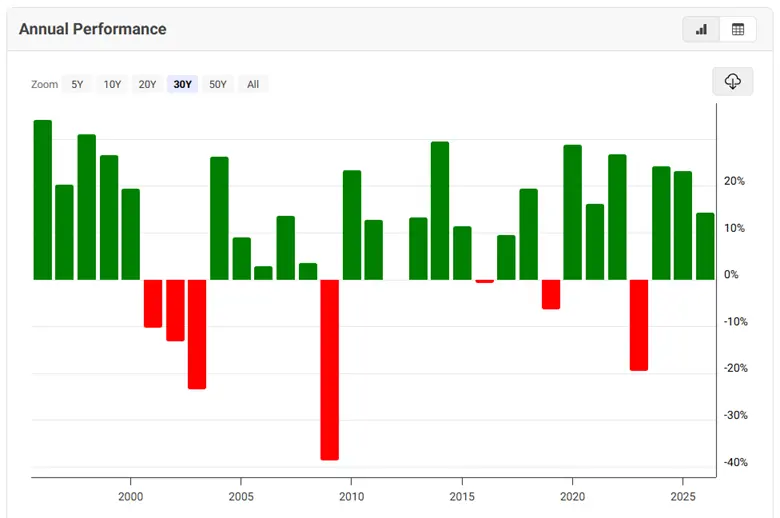
Source: MacroTrends.net
Of course the index is made of 500 individual stocks which all have their own performance records.
And some of those have done very well indeed.
For example memory chip maker Western Digital WDC US is up +271.0% year to date, its rival Seagate Technology, STX US, is up by + 221.0%, and Gold miner Newmont NEM US has put on +167.20%, in 2025, year to date.
S&P 500 Year to date out performers
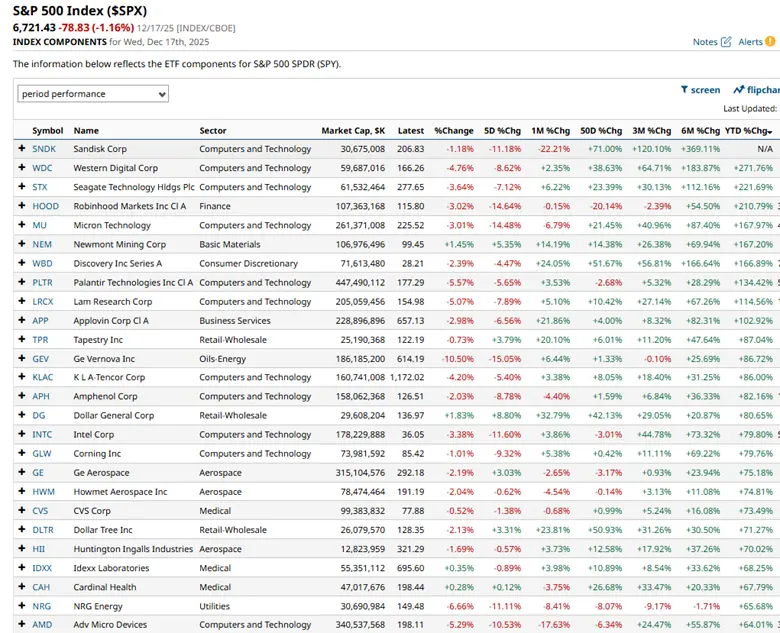
Source:Barchart.com
One possible way to play the market in 2026 might be to stay with the stocks that outperformed it in 2025.
Though as we can see above, some of the gloss is being wiped off of these momentum plays, as we move into the later stages of December.
Several of the leading stocks, have suffered sharp drops over the last week.
Most likely as a result of profit taking (and in some cases) a change in sentiment towards the stock/sector.
We will need to wait and see, if, that trend continues into the New Year.
We can’t all be above average
Of course, by definition, not every stock can outperform the index.
And looking among those names that were below average performers in 2025, could also be the basis for a trading strategy as we enter 2026.
The table below shows stocks that have underperformed the S&P 500, over the last 3 months. Ranked by their relative performance (in ascending order) and then filtered for stocks,which are up by at least +4.0% in the last 5 days, as of 17-12-2025.
High beta stocks in the list have been highlighted in yellow: these are stocks which are more sensitive to changes in the value of the S&P 500 than their peers.
.
Stocks that have underperformed the S&P 500 over the last 3 months
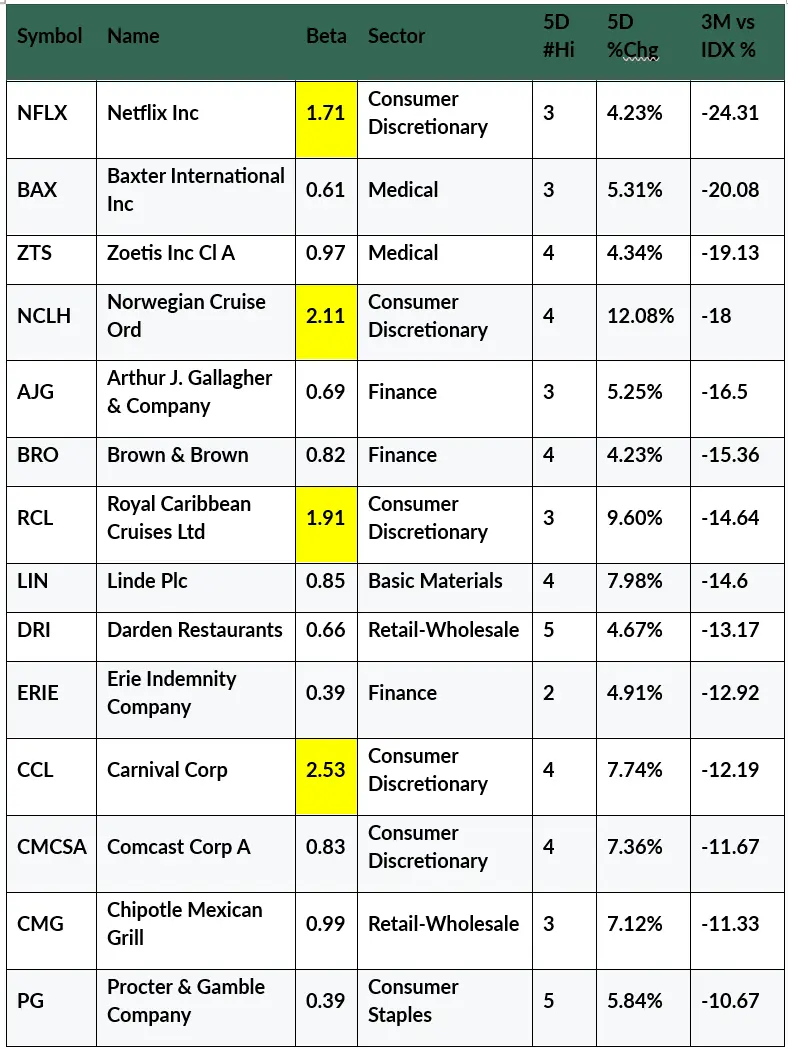
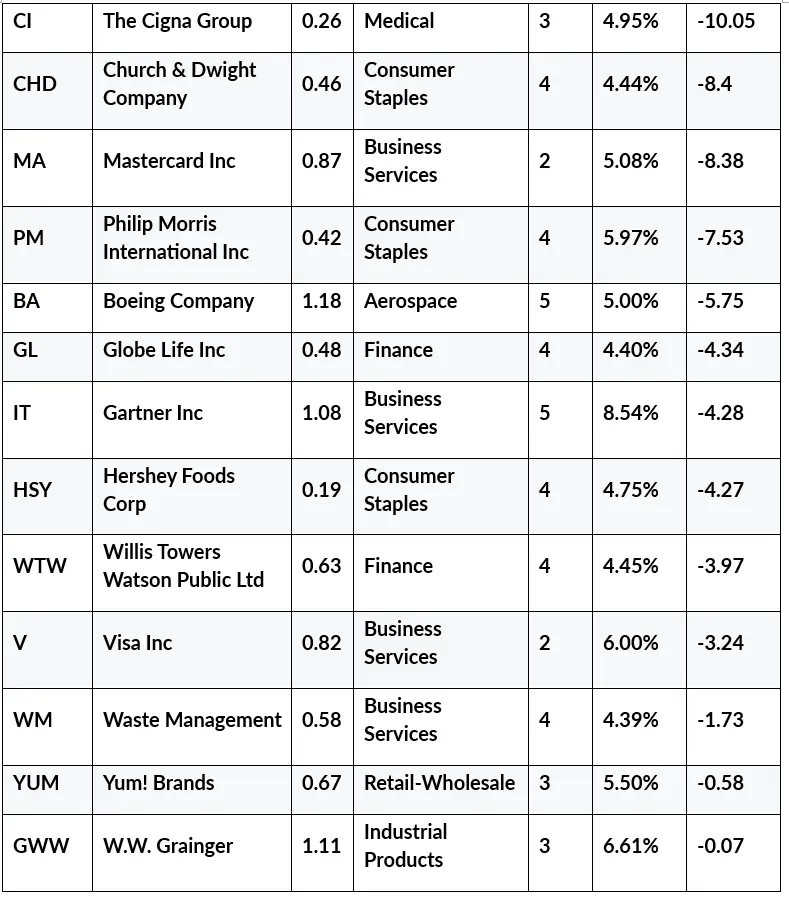
Source: Darren Sinden/Barchart.com
Looking at the table above, cruise lines NCLH, RCL and CCL have all rebounded over the last week, and all three qualify as high beta stocks.
Technology consultants Gartner, IT US, have added +8.54% in the last week. Posting 5 new 5-day highs (see 5D #Hi) as they did so.
While industrial gases group Linde, LIN US, is up by just under +8.0% and have posted 4 new 5-day highs, over the last 5 trading days,
Traders might also want to consider looking at some other areas of the market for inspiration
It’s easy to forget that there is life away from the mega and large-cap names in the S&P 500.
And as a result, small and mid-cap stocks can easily be overlooked.
Though that might be a mistake, as we can see in the charts below.
The S&P 600 Small cap Index ETF IQY (black) and the Russell 2000 ETF IWM (magenta) have been outperforming the S&P 500 SPX (turquoise) and the S&P Equal Weight index ETF RSP (orange), over the last month.
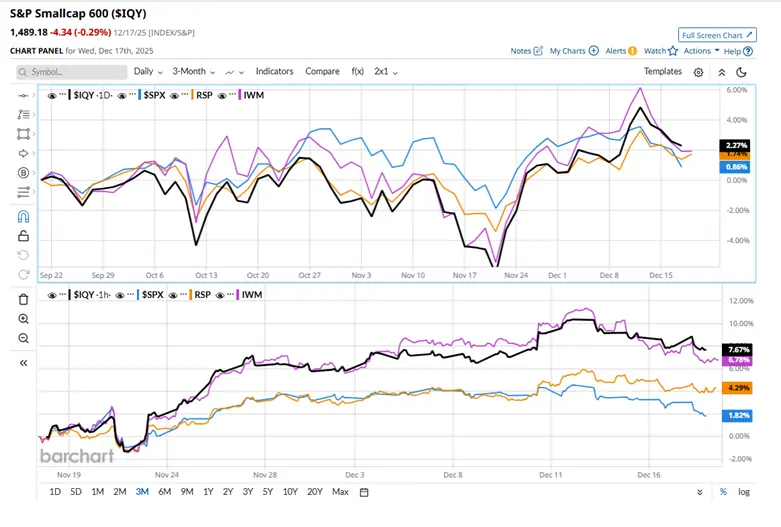
Source:Barchart.com
What's also clear is that the equal-weight S&P 500 ETF RSP (orange) has also outperformed the market-cap-weighted version of the index (see the lower window), which tells us that it's been a stock pickers market over the last month.
The two small-cap indices/ETFs have returned +7.67% and +6.76%, respectively in December, and when you compare that to the S&P 500's year-to-date performance, you could argue that the small/mid caps have been turbocharged.
Why might that be?
Well, this has probably got quite a bit to do with it:
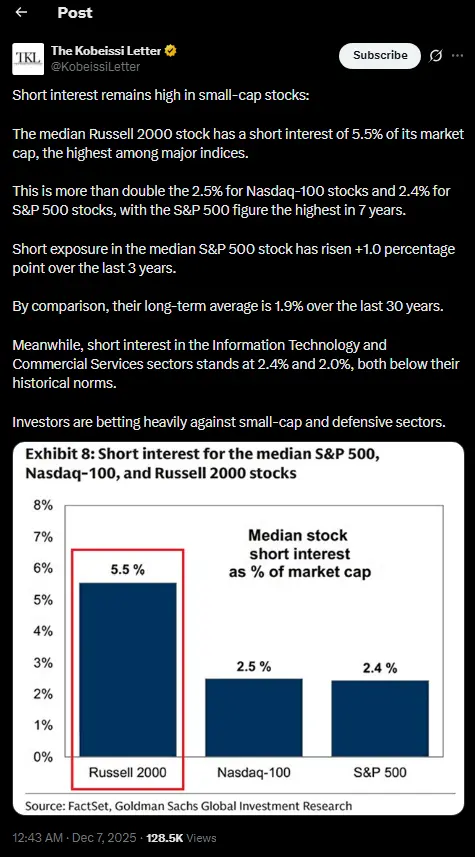
Source: The Kobeissi Letter /X
Significant short positions in small-cap and mid-cap stocks are being “squeezed”, which effectively leverages the moves that are being made in those sectors.
Here is a flavour of how the best performers in IQY, the S&P 600 Small Cap Index ETF, have been getting on, over the last month.
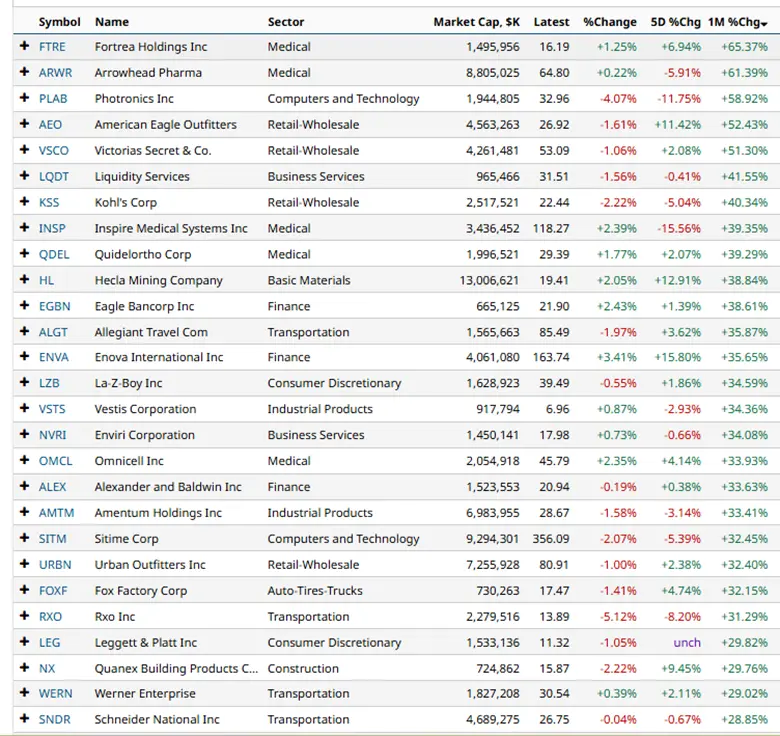
Source:Barchart.com
I hope that’s given you some food for thought and perhaps some ideas about how to approach the coming year.
The information provided does not constitute investment research. The material has not been prepared in accordance with the legal requirements designed to promote the independence of investment research and as such is to be considered to be a marketing communication.
All information has been prepared by ActivTrades (“AT”). The information does not contain a record of AT’s prices, or an offer of or solicitation for a transaction in any financial instrument. No representation or warranty is given as to the accuracy or completeness of this information.
Any material provided does not have regard to the specific investment objective and financial situation of any person who may receive it. Past performance is not a reliable indicator of future performance. AT provides an execution-only service. Consequently, any person acting on the information provided does so at their own risk. Forecasts are not guarantees. Rates may change. Political risk is unpredictable. Central bank actions may vary. Platforms’ tools do not guarantee success.