There is a school of thought that suggests that markets are efficient, which means that the prices for assets within them, reflect all available information, including the prevailing levels of supply and demand, trader sentiment, geopolitics and the economy, at a local, national, regional and global level.
The market does this by summarizing the inputs of millions of agents- that’s traders, investors, analysts etc. to create a price for a given asset or asset class. Those prices are adjusted as new information emerges and is processed by the market.
Not a new theory
Academics Benoit Mandlebrot, Eugen Fama and Paul Samuleson worked on and helped to develop, what has become known as, the efficient-market hypothesis, in the 1960s and 70s.
Although their work can trace its roots back to a PhD thesis, written in 1900, by French mathematician Louis Bacheller, called the Theory of Speculation.
If markets are efficient then they ought to be predictable, if they are not then the price action would be completely random.
Although somewhat ironically, Paul Samuleson won a Noble prize for his work, which showed that the so-called random walk was actually an indicator of market efficiency. But that's another story.
Ongoing debate
There is and has been an ongoing debate about whether markets are efficient or random ever since the theories were first formulated.
As with many things in the market my take is this: Both viewpoints can be right, it just depends on the timescale they are measured over and the position of the observer.
Lucrative opportunities
Markets do appear to miss-price assets, and looking for and exploiting that mispricing could be very lucrative.
After all it’s the strategy that effectively created the Hedge Fund industry and the Value investing style.
As of the end of 2024, Hedge Funds were estimated to have $4.51 trillion of AUM of assets under management worldwide. These funds will often be leveraged by the fund managers to have an even greater impact in the market.
In the end the academic and philosophical debate about efficiency and randomness is somewhat irrelevant, if as a trader, you can make money in the near term from mispricing.
Relative values
And what we are really talking about when we talk about the potential of profiting from mispricing are relative value trades.
Relative value trades are based on the idea that asset prices are correlated with each other in some way.
So for example, a share within an equity index, such as the FTSE 100, is sensitive to performance of the index and by extension by the performance of the other shares within it.
However, the price of our FTSE 100 stock might also be influenced by price changes in the shares of competitor companies whether at home or abroad, or the share prices of companies within their supply chain or customer base.
And given that the same valuation methodologies are applied to equity markets around the world it follows that equity indices are also correlated or sensitive to the performance or valuation of other stock indices.
Positive or negative
Of course, the degree of sensitivity or correlation can vary greatly, and the relationship could be positively or negatively correlated.
Under a positive correlation the price of both A and B move in the same direction at the same time.
Whilst under a negative correlation the prices of A and B move in the opposite direction to each other.
A real-world example
In the chart below, which plots the performance of European stock indices on two axis:
Year over Year performance is shown on the horizontal axis, with Month over Month performance on the vertical axis.
The strongest performers are found in the top right-hand quadrant of the chart. The weakest performers will be found in the bottom left quadrant.
European Stock Indices YOY % Change vs MOM% Change (14-02-2025)
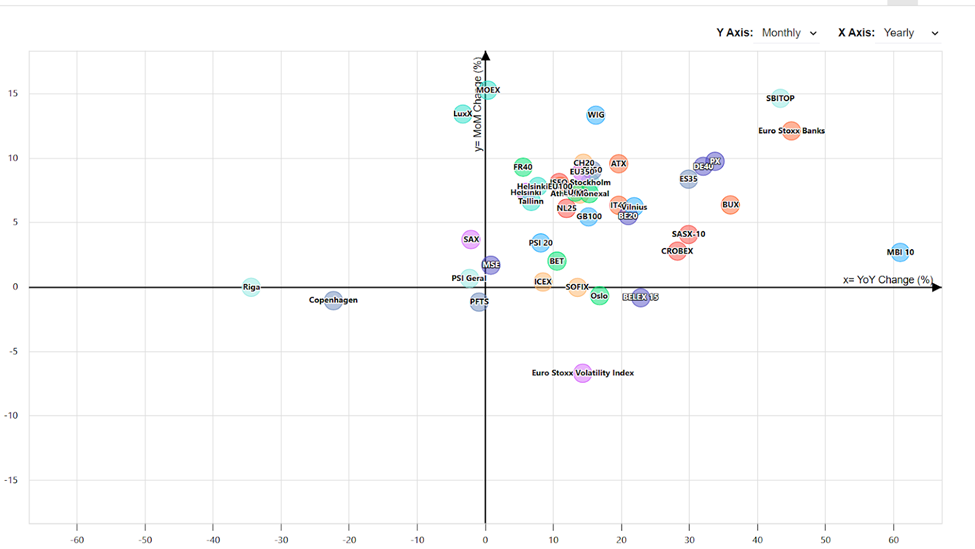
Source:Trading Economics
Wonderful, wonderful Copenhagen
We can see a clear underperformer in the shape of the Copenhagen 20 index which is found in the bottom left quadrant. The index is detached from almost all of its peers, most of which are to be found in the top right-hand quadrant.
Now, I originally drew this chart back on February 14th when I shared it with the members of trading Discord I contribute to.
Saying:
“Speaking of mean reversion, anyone for Denmark?”
Adding that
“It (the Copenhagen 20 index) could be found midway over on the LHS, (of the chart) as a massive underperformer to the rest of Europe”
Let’s look at the same chart today- which we can see below.
I have annotated the chart with a red arrow indicating the direction of travel of the Copenhagen 20 index since 14th Feb.
European Stock Indices YOY % Change vs MOM% Change (26-02-2025)
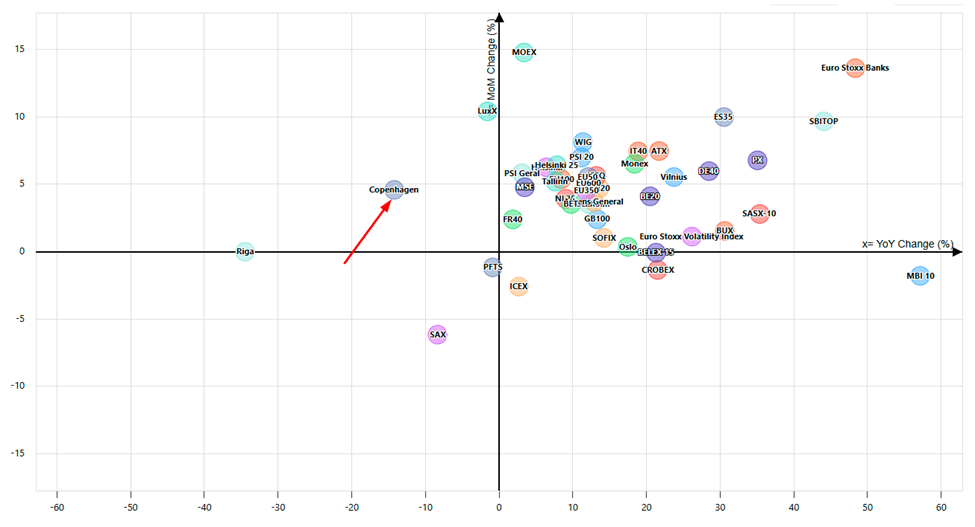
Source:Trading Economics
Shown in context
Let’s put that move into context, with a more traditional price chart, such as the one below.
That shows the percentage change in the Copenhagen 20 index, since the 14th of February. As you can see it’s up by almost +10.30% in that time frame.
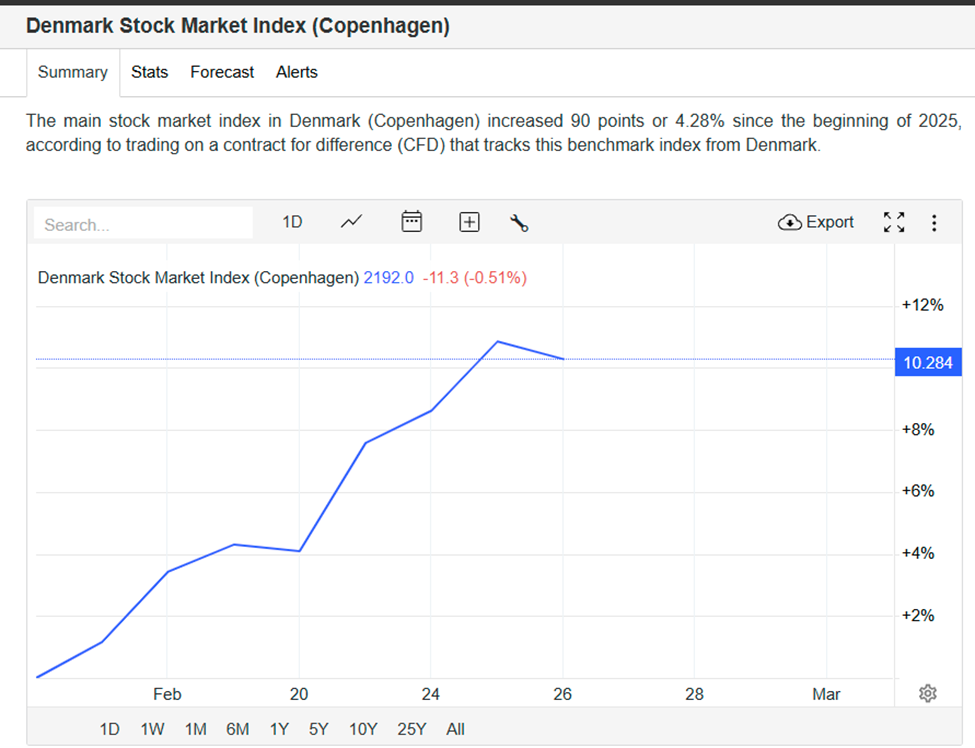
Source:Trading Economics
In my discord comments I mentioned “mean-reversion” which is the idea that prices will return to their average level over time. The theory can also be applied to the relationships between assets, which I also talked about earlier.
Why does that matter?
Well, it means that you didn't have to know anything else about the Copenhagen 20 index, other than the fact that it was out of kilter with its peers. to have been able to exploit that discrepancy.
Here is the Copenhagen 20 index (blue) versus the Euro Stoxx 50 index (green) over the period in question and we can clearly see how it closed the gap.
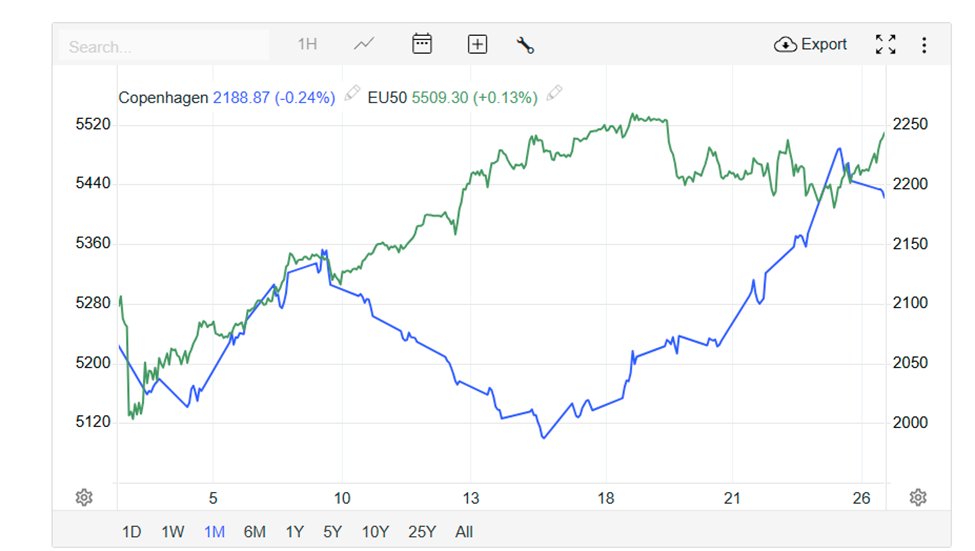
Source:Trading Economics
And here is why it all happened in the first place-
This chart shows the Copenhagen 20 Index versus its largest constituent, Novo Nordisk. The maker of the weight loss drugs Ozempic and Wegovy among others and where one leads the other follows.
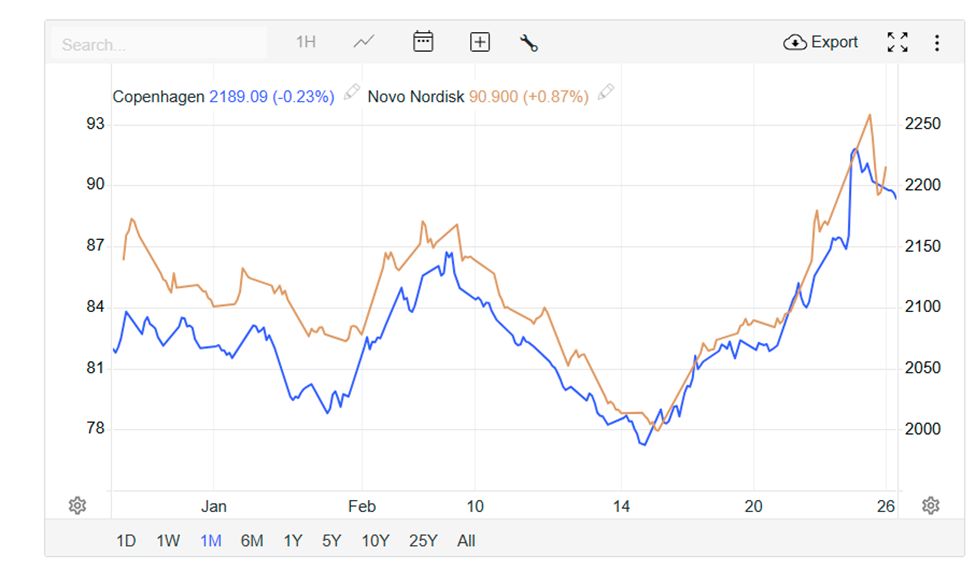
Source:Trading Economics
As is often the case with my trade ideas, all of this was created using freely available resources, that are also free of charge, well established theories, and some logical thinking.
The information provided does not constitute investment research. The material has not been prepared in accordance with the legal requirements designed to promote the independence of investment research and as such is to be considered to be a marketing communication.
All information has been prepared by ActivTrades (“AT”). The information does not contain a record of AT’s prices, or an offer of or solicitation for a transaction in any financial instrument. No representation or warranty is given as to the accuracy or completeness of this information.
Any material provided does not have regard to the specific investment objective and financial situation of any person who may receive it. Past performance is not a reliable indicator of future performance. AT provides an execution-only service. Consequently, any person acting on the information provided does so at their own risk.