
Lately I have been talking about listening to what the market is telling you, before you act to ensure you are trading with and not against the path of least resistance.
The reason for that?
Simple logic really- you stand a better chance of having a favourable outcome on a trade, if you are trading with the market, than you do by trading against it.
Successful trading is all about slanting the odds of a trade in your favour as much as possible, combined with a disciplined approach to money and risk management.
Traders also need to be adaptable, pragmatic and open minded, if they are to become profitable over the long term.
However, that pragmatic approach and open mindedness, can be used to good effect in the short term as well.
Here is a real world example, from Tuesday’s session (27-01-2026).
The chart below shows German Sportswear maker PUMA Se PUM GR.
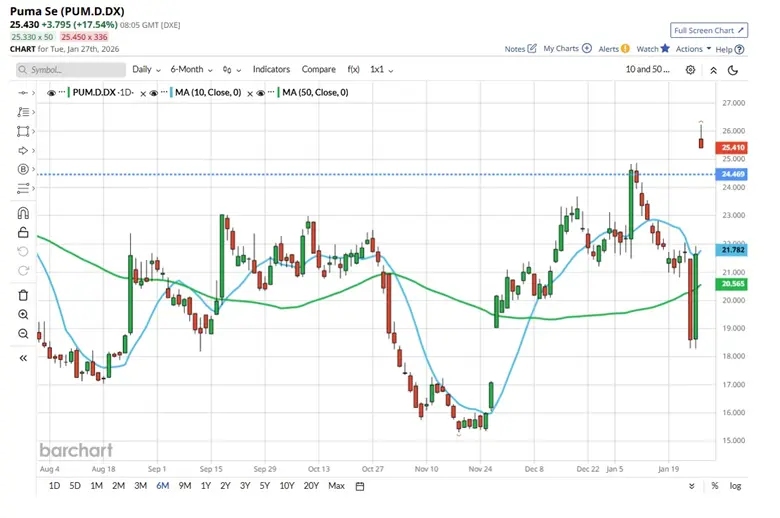
Source: Barchart.com
Note that the stock was up +17.54% soon after the open.
Veering Left
However, despite that substantial move up in price, something wasn’t right. In fact it was very left.
Left on the smile chart that it is. These are chartsIi have created myself, that allow me to visualise price action strength and weakness in a stock, relative to their peer group.
Instinctively you would expect Puma to be showing relative price action strength, and to be over on the right hand side of the smile (the higher up and further over to the right a stock the better). However, as you can see the exact opposite turned out to be true.
Puma was actually high up and far over to the left of the smile. A sure sign of relative price action weakness in the stock.
The market was telling us it was right to fade the rally in Puma. Because the sharp move higher wasn’t being supported, buyers weren’t in control, even with the stock up +17.54%
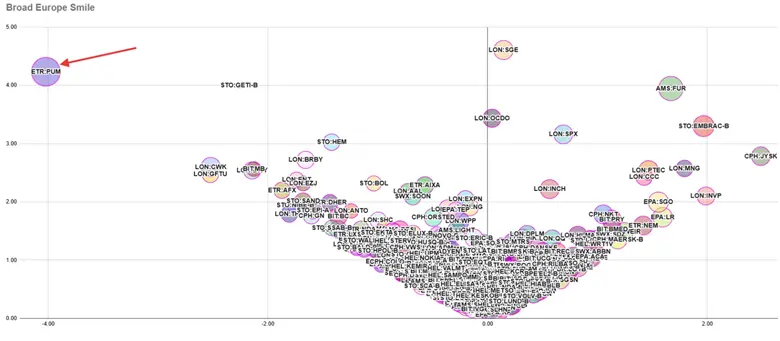
Source: Darren Sinden
Our next chart of Puma, is drawn just 8 minutes after the first chart above.
In this instance the chart is plotted over two time frames - daily over 6 months (upper window) and a 5-minute chart, over a single day (lower window).
However first, let’s go back to the candle chart shown above.
Do you notice anything specific?
Hopefully you spotted two things: Firstly the significant price differential between the Puma candle charts, and secondly, Tuesdays candle on our first chart, has the look of a “shooting star”.
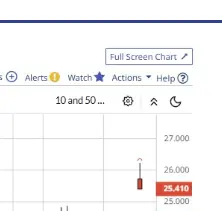
This is what’s known as a high wave candle, and it tells us that the price is rejecting the higher levels.
And indicates, that the price may reset (move lower) to try and tempt buyers back into the market.
I say may, because this pattern appeared at the very beginning of the trading day, and strictly speaking it wouldn’t be confirmed until the end of the days session.
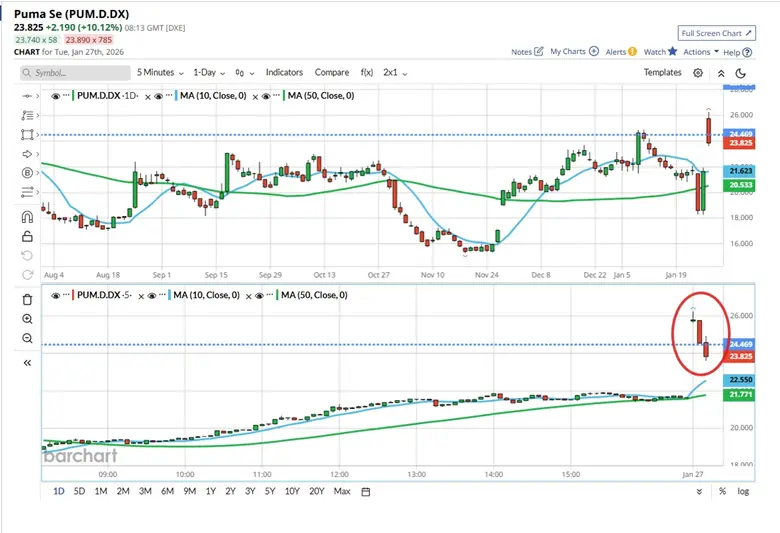
Source: Barchart.com
However, as we can see in the lower window of the chart above, Puma posted three consecutive lower lows, which of course, is part of, the signature of a downtrend.
Gap and Retracement
The green arrow on the chart below plots the range of the gap higher in Puma from the open, the pink arrow shows the retracement, in the price thereafter.
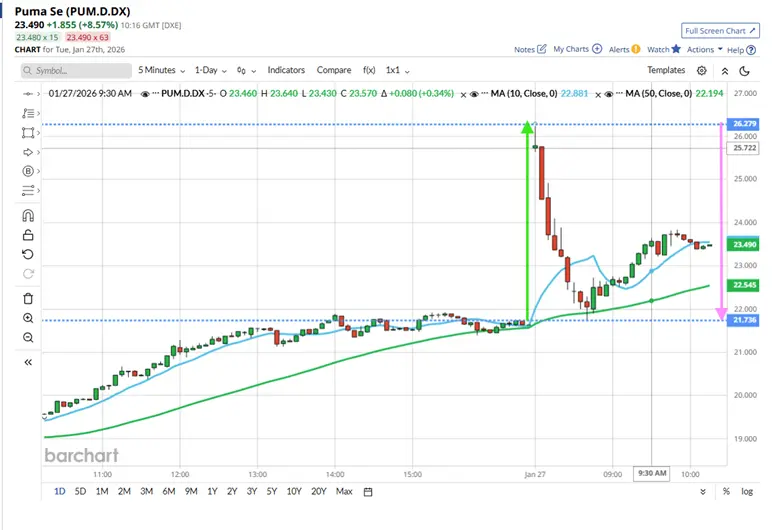
Source: Barchart.com
Not Smiling
Here is another snap shot of my Broad Europe Smile taken just after 9.30 am on Tuesday morning.
In the first snap shot of the smile, Puma was to be found just beyond -4.0 on the horizontal access.
But, in this updated view we see it’s moved much further to the left, and now sits just before -15.0 on that access, and Puma is completely detached from the rest of the stock universe.
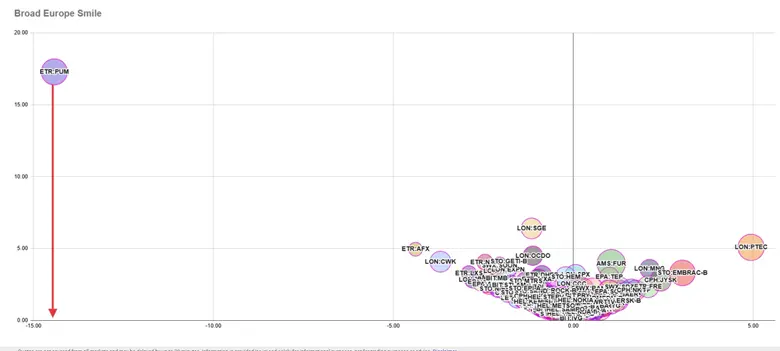
Source: Darren Sinden
The takeaways from this exercise are:
That the market is constantly giving off signals, over multiple time frames, and it's worth looking at the charts of an instrument over multiple time frames, to get a feel for what the market is really saying.
Don’t always take a move at face value, dig a bit deeper, look below the surface to see what the price action is really saying.
Be prepared to act quickly, if what you are seeing in the price action is counter to the direction of the initial move, be it higher or lower.
If you do open a trade in a situation like this, remember that the market is looking for the new equilibrium price, at which buyers or sellers can be attracted into the stock .
At some point it will find that equilibrium and when it does, a new regime will take over.
That will often be the signal to close your trade.
In this case that happened with the appearance of a hammer candle, on the 5-minute chart above. Subsequent to which, the Puma price bounces away from the blue dashed horizontal support line.
The information provided does not constitute investment research. The material has not been prepared in accordance with the legal requirements designed to promote the independence of investment research and as such is to be considered to be a marketing communication.
All information has been prepared by ActivTrades (“AT”). The information does not contain a record of AT’s prices, or an offer of or solicitation for a transaction in any financial instrument. No representation or warranty is given as to the accuracy or completeness of this information.
Any material provided does not have regard to the specific investment objective and financial situation of any person who may receive it. Past performance is not a reliable indicator of future performance. AT provides an execution-only service. Consequently, any person acting on the information provided does so at their own risk. Forecasts are not guarantees. Rates may change. Political risk is unpredictable. Central bank actions may vary. Platforms’ tools do not guarantee success.