
As one of the most well-established and respected tropes of the financial markets, learning about the Dow Jones Industrial Average is essential for every trader. With our clear and informative guide, you will learn exactly what the Dow Jones Index is, how it's calculated, and how to interpret both live and historical data to gain a broad market overview, build predictions and support your personal trading goals.
What Is the Dow Jones Index?
Also known as the Dow Jones Industrial Average (DJIA) or ‘the Dow’, the Dow Jones Index is a stock index made up of 30 prominent blue-chip industrial and financial companies (“constituents”) listed on stock exchanges in the United States. It includes many household names such as Disney, Amazon and Coca-Cola.
When we compare the Dow Jones to other indices, such as Dow Jones vs S&P 500, its scope is more limited due to being comprised of just 30 companies. However, the Dow acts as a valuable yardstick from which to measure and assess activity across the wider stock market and US economy. As one of the oldest and most popular equity indices, it is also more accessible than many others due to the smaller number of companies listed.
How Does the Dow Jones Work?
The indices on Dow Jones are price-weighted, meaning values are based on the price of each stock as opposed to market capitalisation. Its value is taken from the share prices of all 30 constituents, the total of which is then divided by the ‘Dow divisor’.
The divisor is continually adjusted and tweaked to account for corporate activity such as stock splits, that influence the structure of the market. This ensures that the Dow Jones average meaning remains relevant for investors, as it reflects the most up to date market movements. The continuous adjustments ensure it remains an accurate way to normalise the Dow Jones components and act as a reliable benchmark index.
What Companies Are in the Dow Jones?
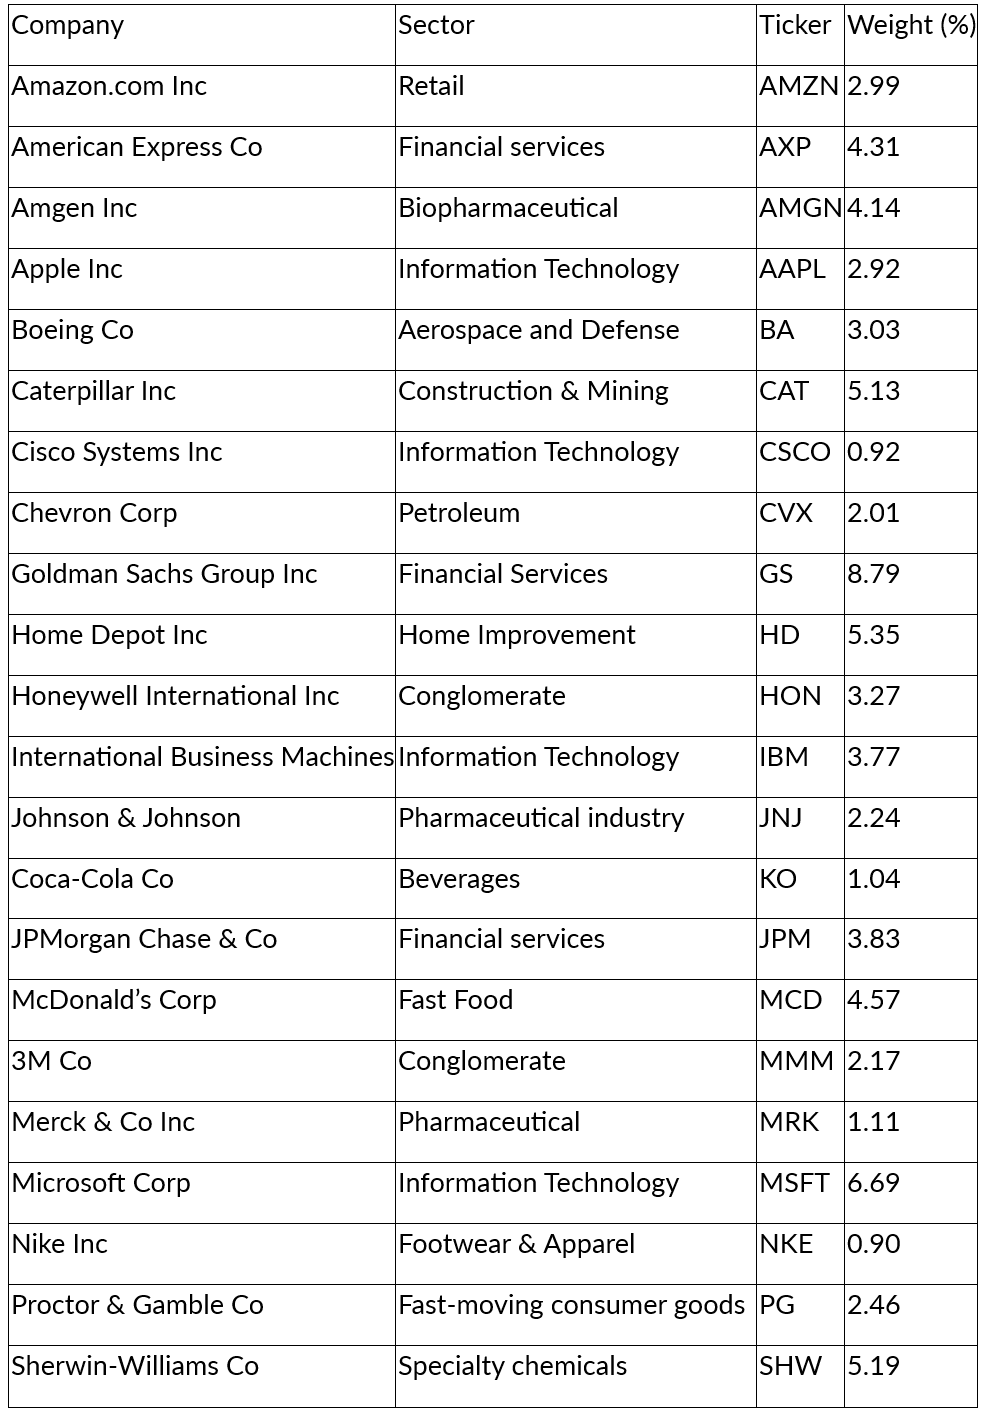
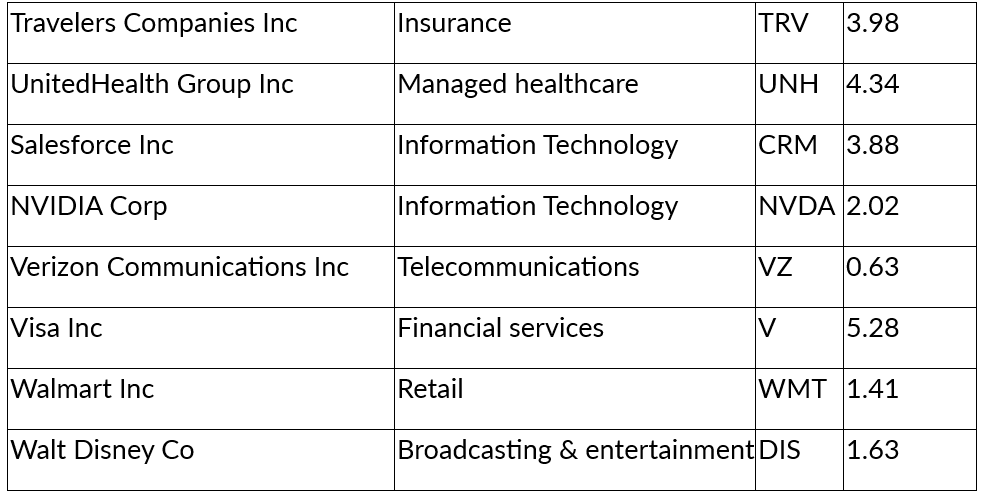
In the below table, we have created a Dow Jones companies list broken down by sector, ticker and weighting. There are a broad range of Dow Jones sectors, encompassing the most influential companies on the stock market today.
Dow Jones Live Chart and Real-Time Data
Broadly speaking, traders are seeking to recognise key price patterns in order to make sense of the Dow Jones chart and live prices. Dow Jones real time data is exceptionally valuable especially in comparison to historical data in order to effectively analyse trends.
Initially, key support and resistance levels should be identified as these help to support further findings.In the live charts, candlesticks represent price movements over a specified period with green candlesticks indicating a higher closing price in comparison to opening and red candlesticks indicating the opposite. Within the candlesticks, traders should look for patterns such as the Doji, where opening and closing prices are similar.
Traders should also be looking out for price movements and trends (e.g. downward, reversal or price spikes), as well as analysing market activity, behaviour and trends during specified timeframes (e.g. 15-minute, 1-hour or 1-day).
Dow Jones Explained: Timeframes and Intraday Trading
The chosen timeframe will typically depend on individual trader strategy – e.g. intraday traders will be looking more closely at short-term timeframes, but it’s also vital to examine longer timeframes to identify any significant trends. These patterns and movements within different timeframes should be looked at simultaneously in order to gather the most accurate and broadest spectrum of data. Price movements should also be considered in connection with volume in order to ascertain the strength of any emerging trends.
Intraday performance is often talked about in connection with Dow Jones. This refers to securities that trade on the market during regular business hours and the highs and lows that the asset price crosses throughout a single day. Intraday securities include exchange-traded funds (ETFs), a type of index-based investing strongly associated with investing in Dow Jones. Intraday trading strategies utilise charts and other technical tools to support efficient high-speed trading .
Analysing the Dow Jones' real-time data should always be done with context in mind. This means staying informed and up to date with the latest economic news, trends and any major events in order to understand the Dow Jones activity within the most relevant framework.
Dow Jones Historical Data and Trends
As one of the most highly regarded indicators of stock market performance and the broad overall health of the US economy, the Dow is also a useful tool for trend analysis using historical data. From 2011 to 2020, the Dow returned an average annual return of 10.7%.
Historical data shows that the market has predominantly moved in cycles, with five bull (upward-trending) markets and four bear (downward-trending) markets over the past 127 years. Since its inception, the DJIA has witnessed many key milestones including expansion to include 30 stocks in 1928, the same year in which it began being calculated with a special divisor, a method that has lasted to the present day.
Dow Jones historical data also shows the dramatic impact that global events have had on its performance. The impact of 9/11 saw one of the largest one-day point drops ever, while COVID-19 saw the Dow drop again in March 2020. However, history also shows the strength and resilience of the Dow in the face of adversity - for example, making a swift recovery and breaking its pre-pandemic high by November 2020.
- 1916: The industrial average expands to 20 stocks. It was expanded again in 1928 to 30, where it still stands.
- 1928: The Dow begins being calculated with a special divisor.
- July 3, 1956: After the longest streak (17 years and three months) without a change in the average, International Paper is added.
- October 30, 1985: McDonald's Corp added to the Dow.
- October 19, 1987: Black Monday sees the Dow experience a major percentage drop.
- November 1, 1999: Microsoft Corp. and Intel Corp. mark the first Nasdaq-listed stocks to join the Dow.
- September 17, 2001: In the immediate aftermath of 9/11, the Dow experiences significant point drops.
- March 5, 2013: The Dow sets a new record high of 14,253.77.
- March 16, 2020: Against the backdrop of COVID-19, the Dow falls dramatically.
- November 16, 2020: The Dow recovers from the impact of the pandemic to break a new high.
- May 16, 2024: The Dow surpasses 40,000 for the first time.
Dow Jones Forecast: What Analysts Are Saying
On Friday 6 June, the Dow Jones forecast looked positive with the blue-chip index up more than 600 points at its highs of the session and the DJIA climbing above the 42,950 level to a high not seen since early March. The index has already gained around 1.6% since the beginning of June and the rises have been attributed to a number of factors including improved relations and eased tariff tensions between the US and China. Current forecasts from a technical perspective paint a neutral to bearish landscape.
Dow Jones forecasting methods typically combine a range of historical, technical and fundamental analysis in order to build effective insights into current and future market movements. This might include technical tools such as Bollinger bands, the RSI (Relative Strength Index) and moving averages, as well as in-depth (statistical) analysis of historical trends.
Key influencing factors on the most effective forecasting methods may consider current economic events as well as the personal risk appetite and goals of the individual trader, which in turn will impact the type of information required.
What Makes the Dow Jones Move?
There are three main factors that make the Dow Jones move – economic events, corporate earnings and market sentiment. All of these factors are closely linked which means they should be considered from a holistic perspective to ensure the overall impact on Dow movement is best understood and predicted.
With the first factor - economic events - the Dow has tended historically to move on an upwards trajectory. However, certain events have seen it fall including in the aftermath of the 9/11 attacks, as well as during the financial crises of 2000 and 2008, and the COVID-19 pandemic.
The corporate earnings of individual companies are another key factor that influences movement. This in turn can heavily impact investor confidence, leading directly to the third factor - market sentiment. This is influenced not only by corporate earnings but also by geopolitical events (e.g. government or economic instability), changes in central bank policies, and economic data such as reports on inflation.
Should You Invest in the Dow Jones?
While it’s not possible to buy stock and invest in Dow Jones itself, there are a number of ways to invest in – and gain – exposure to the Dow and the companies included within the index. Traders can track the performance of the index as a collective via index funds or Exchange Traded Funds (ETFs) that track the Dow’s performance using a broad-based index. This is typically done via a brokerage platform . Traders can buy shares in the ETF and invest in the Dow 30 where the stocks are held in proportion to their weighting in the DJIA.
Index-based investing is far more straightforward and user-friendly than buying shares in individual companies, especially for beginner investors. It is also a good diversification tool but it does come with a level of risk as all investments can drop in value as well as increase.
Why the Dow Jones Still Matters Today
As a stalwart of the economic markets for nearly 1.5 centuries, the DJIA remains one of the most respected and utilised market indices, offering invaluable perspectives on some of the most influential companies in the USA and the US economy as a whole. With longevity and esteem firmly on its side, Dow Jones today remains as valuable as ever, both as a standalone entity and as a trading tool for shrewd investors.
The information provided does not constitute investment research. The material has not been prepared in accordance with the legal requirements designed to promote the independence of investment research and as such is to be considered to be a marketing communication.
All information has been prepared by ActivTrades (“AT”). The information does not contain a record of AT’s prices, or an offer of or solicitation for a transaction in any financial instrument. No representation or warranty is given as to the accuracy or completeness of this information.
Any material provided does not have regard to the specific investment objective and financial situation of any person who may receive it. Past performance is not a reliable indicator of future performance. AT provides an execution-only service. Consequently, any person acting on the information provided does so at their own risk.